

Disclaimer: No match footage, video, or images from the game were used in this analysis. The conclusions below are based exclusively on Football Hacking data, including pass-network structure, Voronoi spatial control, median xT destination, offensive transition xT, recovery-zone xT, corridor xT and Network Health measured in isolated five-minute windows. Set pieces are excluded from the pass-network and spatial analysis.
Barcelona controlled the game through structural consistency
Barcelona’s 2–0 win over Athletic Club in LaLiga 2026/27 is an interesting example of the difference between controlling every statistical dimension and controlling the conditions in which a match develops.
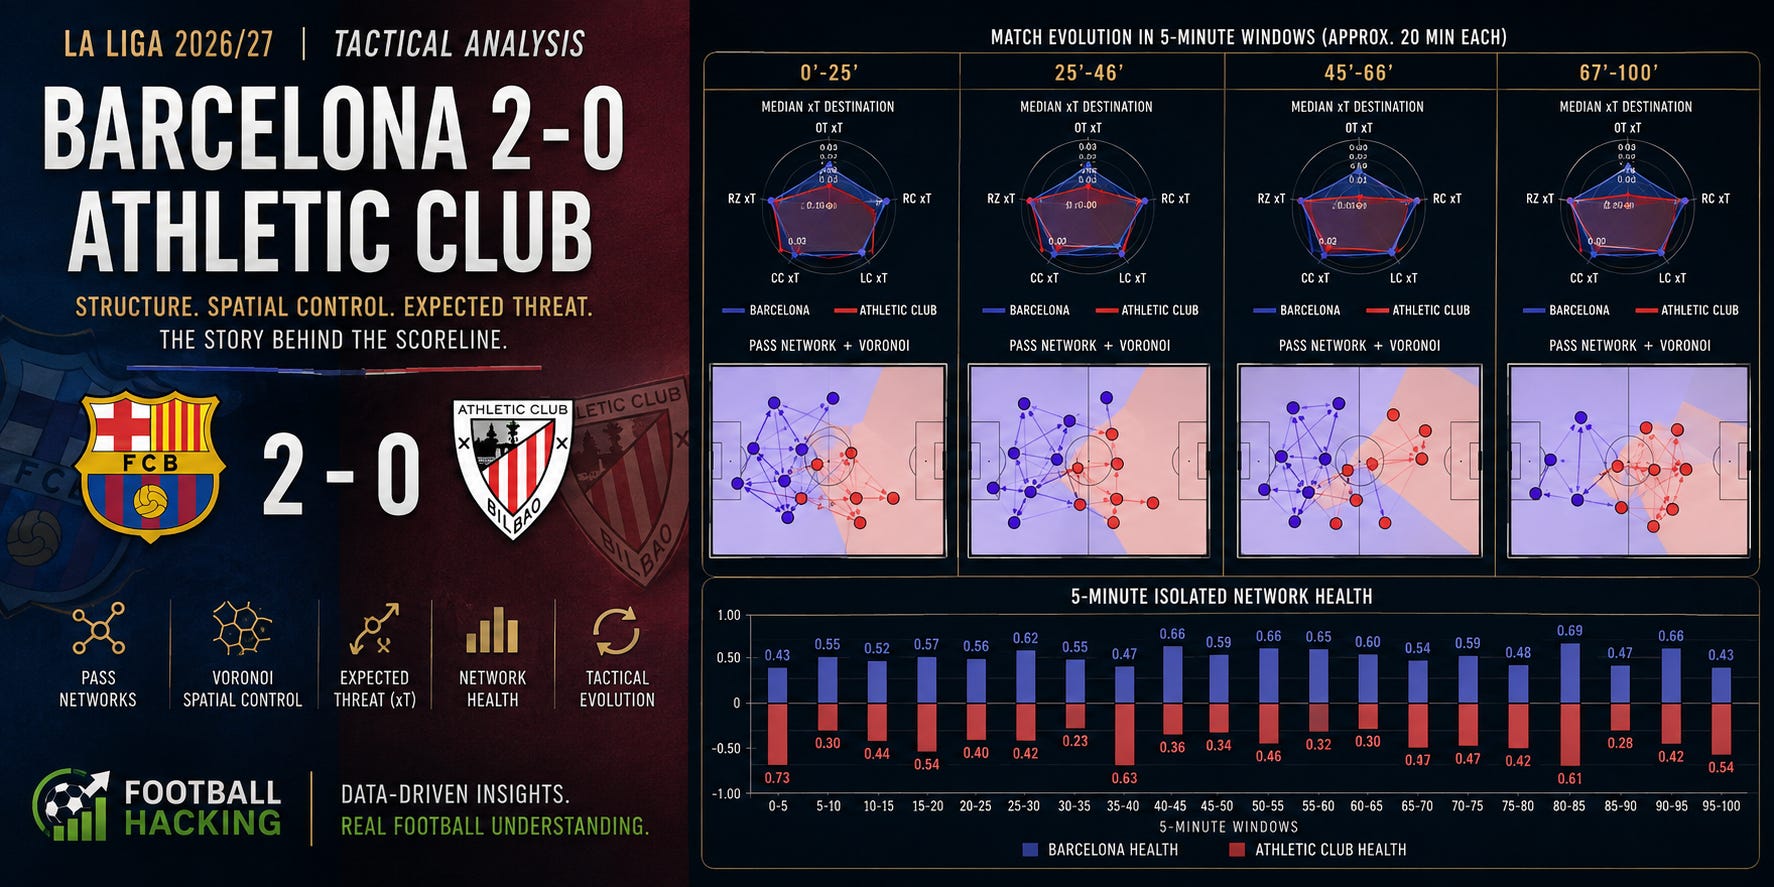
The xT radar does not show Barcelona superior everywhere. Athletic Club reaches higher values in important dimensions, particularly Recovery Zone xT, and in some periods also compares well in Offensive Transition xT. Yet the pass networks, Voronoi maps and Network Health tell another part of the story.
Barcelona maintained a remarkably stable network throughout the match.
Across the five-minute Network Health windows, Barcelona was generally around or above 0.50, with several stronger periods: 0.62 at 25–30, 0.66 at 40–45, 0.66 at 50–55, 0.65 at 55–60, 0.69 at 80–85 and 0.66 at 90–95.
Athletic Club’s structure was much more volatile. Its Network Health dropped as low as 0.23 at 30–35, while Barcelona remained at 0.55 in the same interval.
That contrast is important. The 2–0 was not simply a story of one team permanently occupying the entire pitch. It was also a story of Barcelona preserving functional connections while Athletic’s ability to connect its own structure fluctuated much more strongly.
First 25 minutes: Barcelona establishes the platform
The opening 0–25 minute network already shows the basic geometry that would support Barcelona.
The team had a relatively broad occupation of the pitch, but its passing structure was not stretched into disconnected pieces. Pedri, positioned predominantly in the central-right interior zone around and beyond the halfway line, provided an important point between deeper circulation and advanced occupation.
On the opposite side, Gerard Martín occupied the left corridor and left half-space, higher than Barcelona’s first line and connected to the progression from deeper areas.
This created an important spatial characteristic: Barcelona could occupy both sides while retaining access to the middle.
Athletic Club’s Voronoi control was significant in parts of Barcelona’s attacking half, and the radar actually shows Athletic ahead in Recovery Zone xT and Offensive Transition xT during this phase.
So this was not a case of Barcelona simply suffocating Athletic territorially from the first minute.
Instead, Barcelona’s advantage was structural.
The passing network gave the home side multiple routes for moving from its own half into midfield, while Athletic’s occupation appeared more dependent on isolated areas of control.
The Network Health numbers reinforce that reading. Athletic produced a very strong 0.73 in the opening five minutes, compared with Barcelona’s 0.43, but that relationship quickly changed. Barcelona reached 0.55, 0.52, 0.57 and 0.56 in the following four windows.
Athletic fell to 0.30, 0.44, 0.54 and 0.40.
Barcelona gradually turned the match from an initially competitive structural environment into one in which its own network became considerably more reliable.
25–46 minutes: Barcelona pushes its structure forward
The second section of the first half reveals a subtle but meaningful change.
Barcelona’s network moves further into Athletic territory.
Pedri remains influential around the central and right-central zones, but now operates closer to the attacking structure. Meanwhile, Lamine Yamal provides a much deeper reference on the right attacking corridor, stretching Barcelona’s occupation toward Athletic’s defensive third.
This is where the Voronoi map becomes particularly useful.
Barcelona controls substantial territory through the middle and parts of both flanks, but without concentrating every player in the same central pocket. The network has width, interior connections and depth.
The xT radar also changes.
Barcelona’s Offensive Transition xT rises relative to the opening period, while its right-corridor xT becomes more pronounced. Athletic continues to retain the advantage in Recovery Zone xT, meaning the visitors were still finding recoveries in potentially useful areas.
But recovering the ball in valuable territory and controlling the subsequent structure are not the same thing.
That distinction may be one of the most revealing aspects of the first half.
Athletic could generate territorial value through recovery, while Barcelona was better able to maintain the passing architecture surrounding possession.
And that difference becomes extreme around the half-hour mark.
From 25–30, Barcelona records a Network Health of 0.62 against Athletic’s 0.42. At 30–35, Barcelona remains at 0.55, while Athletic collapses to 0.23, its weakest five-minute structural window of the match.
Barcelona therefore entered the latter part of the first half with increasingly strong control over the game’s connectivity.


The second half begins with a different territorial picture
The 45–66 minute window is perhaps the most interesting section of the match because the spatial picture changes considerably.
Athletic Club increases its territorial presence.
Its Voronoi control expands across large portions of Barcelona’s half and particularly into the left and central areas from Barcelona’s perspective. The radar supports this change: Athletic reaches noticeably higher Recovery Zone xT and right-corridor xT than Barcelona.
Yet Barcelona does something important.
It becomes more compact.
Instead of maintaining exactly the same first-half geometry, Barcelona’s network contracts around the middle and its connections become concentrated in a smaller, more mutually supportive structure.
Pedri now appears in a much denser central attacking area, surrounded by several passing options rather than operating as part of a more expansive positional structure. Raphinha, meanwhile, occupies the right-central attacking channel close to the final third, providing a higher outlet from that compact block.
This distinction matters for understanding control.
Athletic occupied more territory in several areas, but Barcelona retained a connected core from which it could circulate and progress.
And the Network Health data strongly supports that interpretation.
Barcelona records 0.59 at 45–50, 0.66 at 50–55, 0.65 at 55–60 and 0.60 at 60–65.
Athletic records only 0.34, 0.46 and 0.32 in three of those comparable windows.
So Athletic’s territorial improvement did not translate into superior structural health.
Barcelona was conceding portions of the map without conceding the organization of the match.
Territorial control and structural control were not the same thing
This is probably the central tactical-data lesson from Barcelona 2–0 Athletic Club.
A Voronoi map can show where a team controls space based on player positioning. xT can tell us how valuable certain destinations, recoveries or corridors are. A pass network tells us whether those positions actually form a functioning circulation structure.
In this match, those layers occasionally pointed in different directions.
Athletic’s Recovery Zone xT remained consistently stronger through much of the game. The visitors also generated meaningful corridor values and, during the beginning of the second half, controlled substantial areas spatially.
But Barcelona repeatedly maintained the healthier network.
That means Barcelona’s control should not be interpreted merely as “having more territory.” It was closer to controlling the relationships between important areas of the pitch.
That is a different type of dominance.
From 67 minutes: Barcelona changes the nature of its control
The final 67–100 minute window shows the clearest behavioral change.
Barcelona becomes deeper and more compact.
The team no longer needs the same occupation of Athletic’s half seen during parts of the first period. The Voronoi map shows Athletic controlling more territory in advanced areas, while Barcelona’s players form a stronger concentration around midfield and their own half.
The xT radar reflects this change as well.
The two teams become closer in several dimensions, and Barcelona no longer holds the same central-corridor advantage visible in earlier periods.
But this does not produce structural collapse.
Quite the opposite.
Rodri occupies the central zone in Barcelona’s half, just behind the midfield line, helping form the deeper circulation base. Lamine Yamal remains much higher on the right attacking corridor, giving Barcelona a distant outlet while most of the structure contracts behind him.
That separation is useful: Barcelona can defend and circulate with greater density without eliminating its capacity to stretch the field when possession is recovered.
The Network Health numbers are especially revealing here.
Barcelona reaches 0.69 at 80–85, while Athletic is at 0.61. At 85–90, Barcelona falls to 0.47 while Athletic improves to 0.28, but Barcelona then rises again to 0.66 at 90–95, compared with Athletic’s 0.42.
There is no prolonged structural deterioration associated with Barcelona’s deeper positioning.
The team changes how it controls the match rather than simply losing control.
Want to see this analysis inside the Football Hacking Web App?
Explore the same pass networks, Voronoi spatial control, xT by corridor and network structure used in this Barcelona vs Athletic Club analysis — plus Poisson models, match probabilities, fair odds, tactical diagnostics and more.
Athletic Club found valuable zones without sustaining the same network quality
Athletic’s performance deserves a more nuanced reading than the 2–0 scoreline alone suggests.
The radar repeatedly shows the visitors producing higher Recovery Zone xT. Their right-corridor threat is also particularly visible in the 45–66 period.
During the latter stages, Gorka Guruzeta occupies the central attacking zone around Barcelona’s midfield line, giving Athletic a presence between the lines, while Anthony Gordon operates higher toward the right-sided attacking channel, contributing to the visitors’ occupation of Barcelona territory.
This helps explain why the Voronoi maps do not show uninterrupted Barcelona territorial supremacy.
Athletic could advance its occupation and establish players in potentially valuable regions.
The problem visible in the data is what happened around those positions.
Their Network Health frequently remained below Barcelona’s, indicating that the visitors’ spatial presence did not consistently become an equally healthy collective passing structure.
In other words: Athletic could occupy threatening areas, but Barcelona was more consistently connected while doing its work.
Barcelona’s 2–0 was built on adaptation, not one fixed shape
Looking at the match through approximately 20-minute windows reveals something that the full-match network alone would hide.
Barcelona did not play the entire match in the same structural state.
The first 25 minutes established a broad platform with connections across both sides. From 25–46, the structure moved higher and became increasingly established in Athletic territory. Between 45–66, Barcelona became more centrally compact while Athletic expanded its territorial control. From 67 minutes onward, the home side became deeper again, preserving density while maintaining selected outlets further forward.
That sequence matters.
A team controlling a match does not necessarily have to keep pushing its average positions toward the opponent’s goal for 90 minutes.
Sometimes control means advancing.
Sometimes it means compressing.
And sometimes it means deliberately allowing the opponent more territory while preserving the connections that prevent that territory from becoming genuine structural dominance.
Barcelona appears to have moved through all three states.
What the 2–0 tells us about Barcelona’s control
The most striking feature of this Barcelona vs Athletic Club tactical analysis is therefore not a single xT number or one dominant section of the Voronoi map.
It is the persistence of Barcelona’s structure across different match states.
Athletic produced stronger Recovery Zone xT and had periods of significant territorial control. Barcelona nevertheless maintained better Network Health across most five-minute windows and adapted its passing geometry as the match evolved.
The first half was more expansive and increasingly territorial. The early second half became more compact despite Athletic gaining space. The closing phase was deeper and more conservative spatially, but remained structurally connected.
That is why the final score of Barcelona 2–0 Athletic Club fits the underlying network story better than a simple territorial reading might suggest.
Barcelona did not control every part of the pitch at every moment.
It controlled something arguably more important: the stability of its own structure as the geography of the match changed.