


The Hidden Architecture of Brighton’s Passing Game
When we analyze a football team, we naturally pay attention to its most visible actions: progressive passes, successful dribbles, chances created, and goals scored. These events are important, but they do not necessarily reveal how a team maintains its collective organization. Some of the most important connections in football are not particularly spectacular. They may involve a central defender circulating possession, a midfielder providing a supporting option, or a short backward pass that keeps several potential passing routes available. Their significance comes not from the immediate attacking reward, but from the structural relationships they preserve.
This Football Hacking study examines a different question: which passing connections are most important for keeping Brighton & Hove Albion’s network structurally connected, and what happens when those connections are removed?
Our analysis covers eight Brighton matches from the 2026/27 season. Rather than evaluating players according to their attacking output or attempting to predict individual passing decisions, we examine the relationships connecting them. The objective is to identify recurring passing links that are particularly important to the organization of the team, understand where those links operate on the pitch, and explore how an opponent might use that information to challenge Brighton’s normal circulation.
The results point toward an intriguing spatial distinction. Lewis Dunk emerges as a recurring source of structurally important connections across central and left-sided areas, while Diego Gómez stands out on the right, particularly through his passing relationship with Pascal Groß. These are not simply the players who happen to appear frequently in a passing diagram. Their connections have been evaluated according to their role within the wider network and the reduction in connectivity observed when those relationships are removed.
The implications extend beyond Brighton itself. This type of analysis offers a different foundation for opposition scouting: instead of asking only which players are most dangerous with the ball, we can begin asking which relationships help the team remain organized—and which passing options an opponent might try to disrupt.
A Brief Introduction to the Methodology
Our approach combines network science with spatial pattern recognition. First, Edge Betweenness Centrality (EBC) helps identify passing connections that occupy important positions within the team’s network. In simple terms, certain connections act as bridges between different players and possible routes of circulation. Their structural relevance may be greater than their passing frequency alone would suggest.
We then examine how removing these connections affects directed global network efficiency, a measure of how effectively players remain connected through the available passing routes. The purpose is not to simulate an actual match in which passes mysteriously disappear, but to test the structural dependence of the network on particular relationships.
Once the critical connections have been identified, we recover their spatial passing activity and apply KMeans clustering to recognize broader recurring patterns. DBSCAN subsequently refines those patterns by identifying denser concentrations and separating more isolated observations. Finally, pass flow maps provide a visual interpretation of where the selected passes originate and the average directions in which they travel.
These techniques address complementary questions: which connections matter structurally, where their passes occur, and whether those spatial behaviors repeat across matches. The emphasis throughout is on identifying meaningful tendencies rather than claiming that a football team’s behavior can be reduced to a rigid or deterministic model.
How Vulnerable Is Brighton’s Passing Network?
Before investigating individual players, it is useful to understand how Brighton’s overall network responds to the loss of connections.
The first visualization compares the deterioration of directed global efficiency across all eight matches. Each curve begins with the original network and follows its remaining efficiency as structurally important connections are progressively removed. The horizontal axis expresses the percentage of initial connections removed, while the vertical axis shows the percentage of efficiency retained.
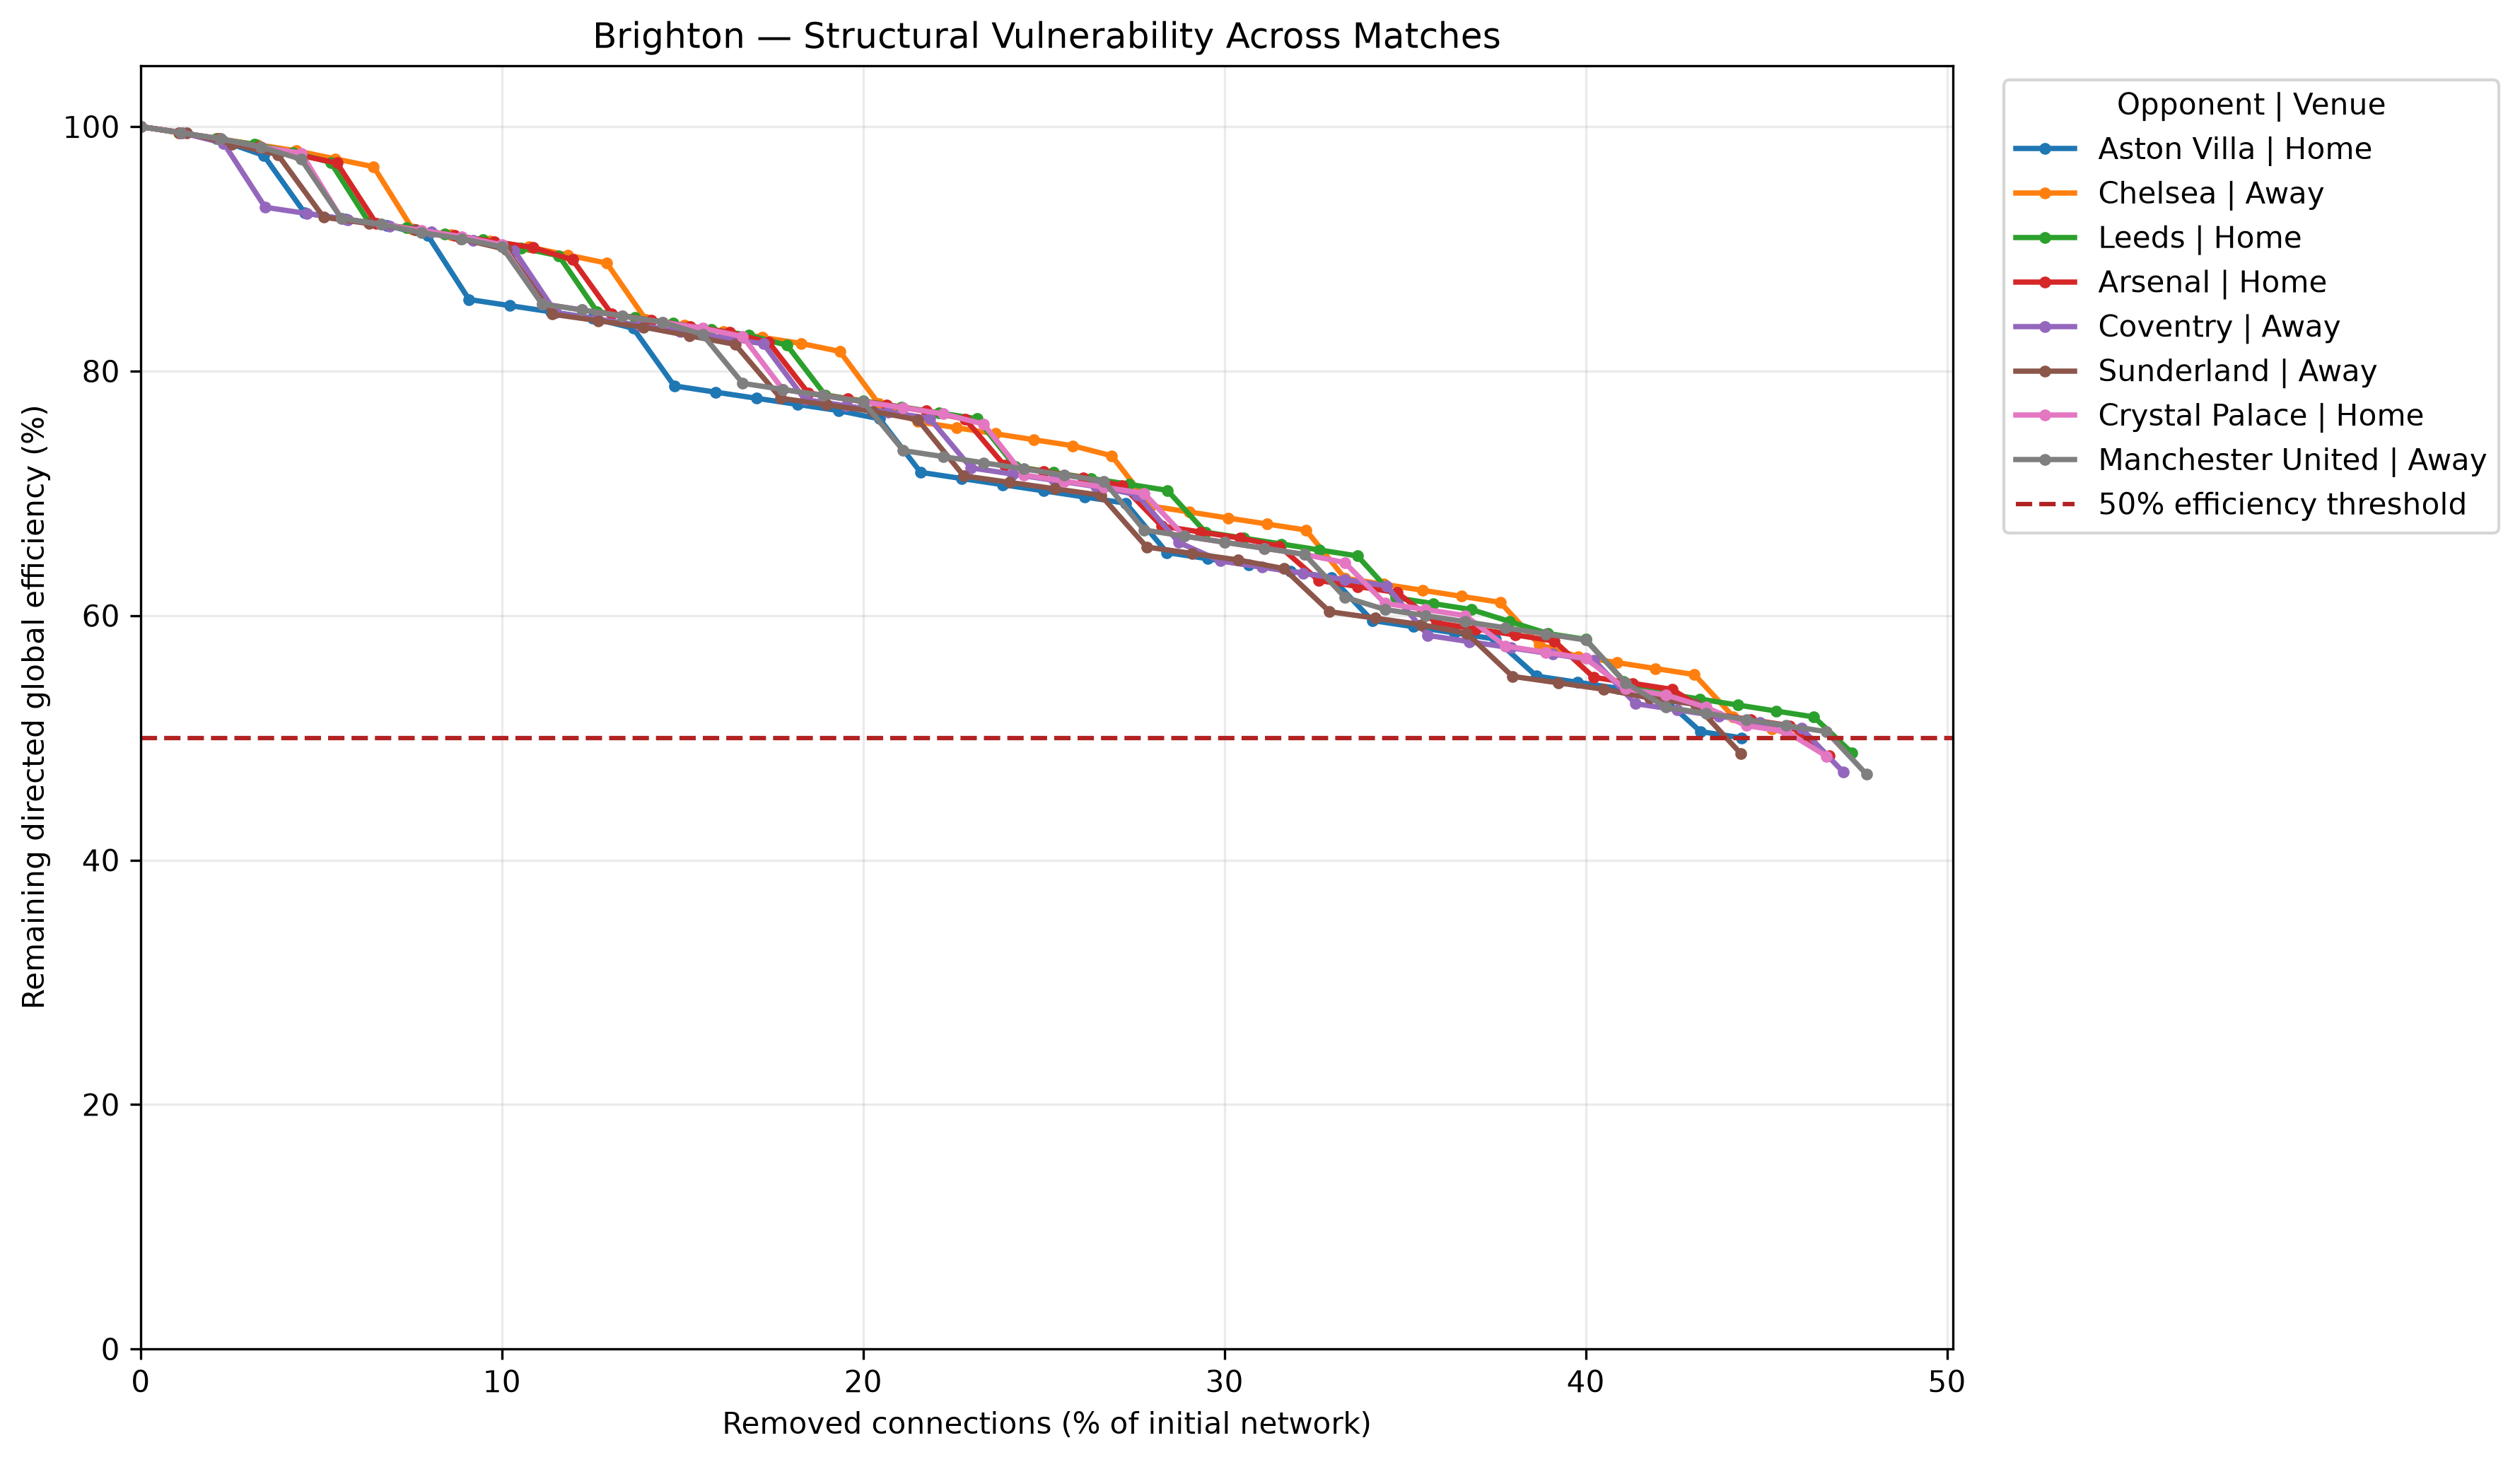
One of the most interesting characteristics of this graph is the similarity between matches. Despite different opponents and match circumstances, Brighton’s network follows broadly comparable deterioration curves. The paths are not identical, but there is a recognizable consistency in the relationship between the loss of connections and the decline in global efficiency.
This is an important observation because it suggests that the team’s structural organization is not completely reinvented from one match to another. Different combinations of players and decisions may produce different passing sequences, yet the network appears to retain broadly similar characteristics when tested under the same form of structural disruption.
Another important point is that the network does not immediately collapse when its first critical connections disappear. In the analyzed matches, reducing global efficiency by approximately half requires removing a substantial proportion of the original directed connections—roughly 45–48%, according to the visualization. That indicates a meaningful degree of structural redundancy: alternative routes remain available as individual relationships disappear.
However, the overall resilience of the network does not mean that every connection contributes equally. Within this relatively stable structure, some relationships are more consequential than others. Identifying those relationships—and understanding their spatial distribution—is where the analysis becomes tactically useful.
For an opposition analyst, the distinction matters. The objective should not be to identify a single magical passing lane whose removal guarantees success. Football networks usually offer alternatives. A more realistic objective is to locate the relationships whose disruption may force the team to reorganize its circulation, redistribute responsibility, or operate through less familiar routes.
Why Three Spatial Passing Patterns?
Having established the structural importance of individual connections, the next challenge is to understand whether their passes form recognizable spatial patterns.
A long list of critical passing relationships is not particularly useful for a coach unless those relationships can be placed in a tactical context. Knowing that a connection matters is only part of the picture. Knowing where it usually operates can help translate that information into positioning, pressing responsibilities, and decisions about which spaces should be protected or contested.
Our spatial analysis initially identified three principal patterns through KMeans clustering. The decision was supported by the relationship between two measures of clustering quality: Inertia, which reflects how tightly observations are grouped, and Silhouette Score, which evaluates how distinctly those groups are separated. Three clusters offered the strongest Silhouette Score among the configurations evaluated, alongside a substantial early reduction in Inertia.
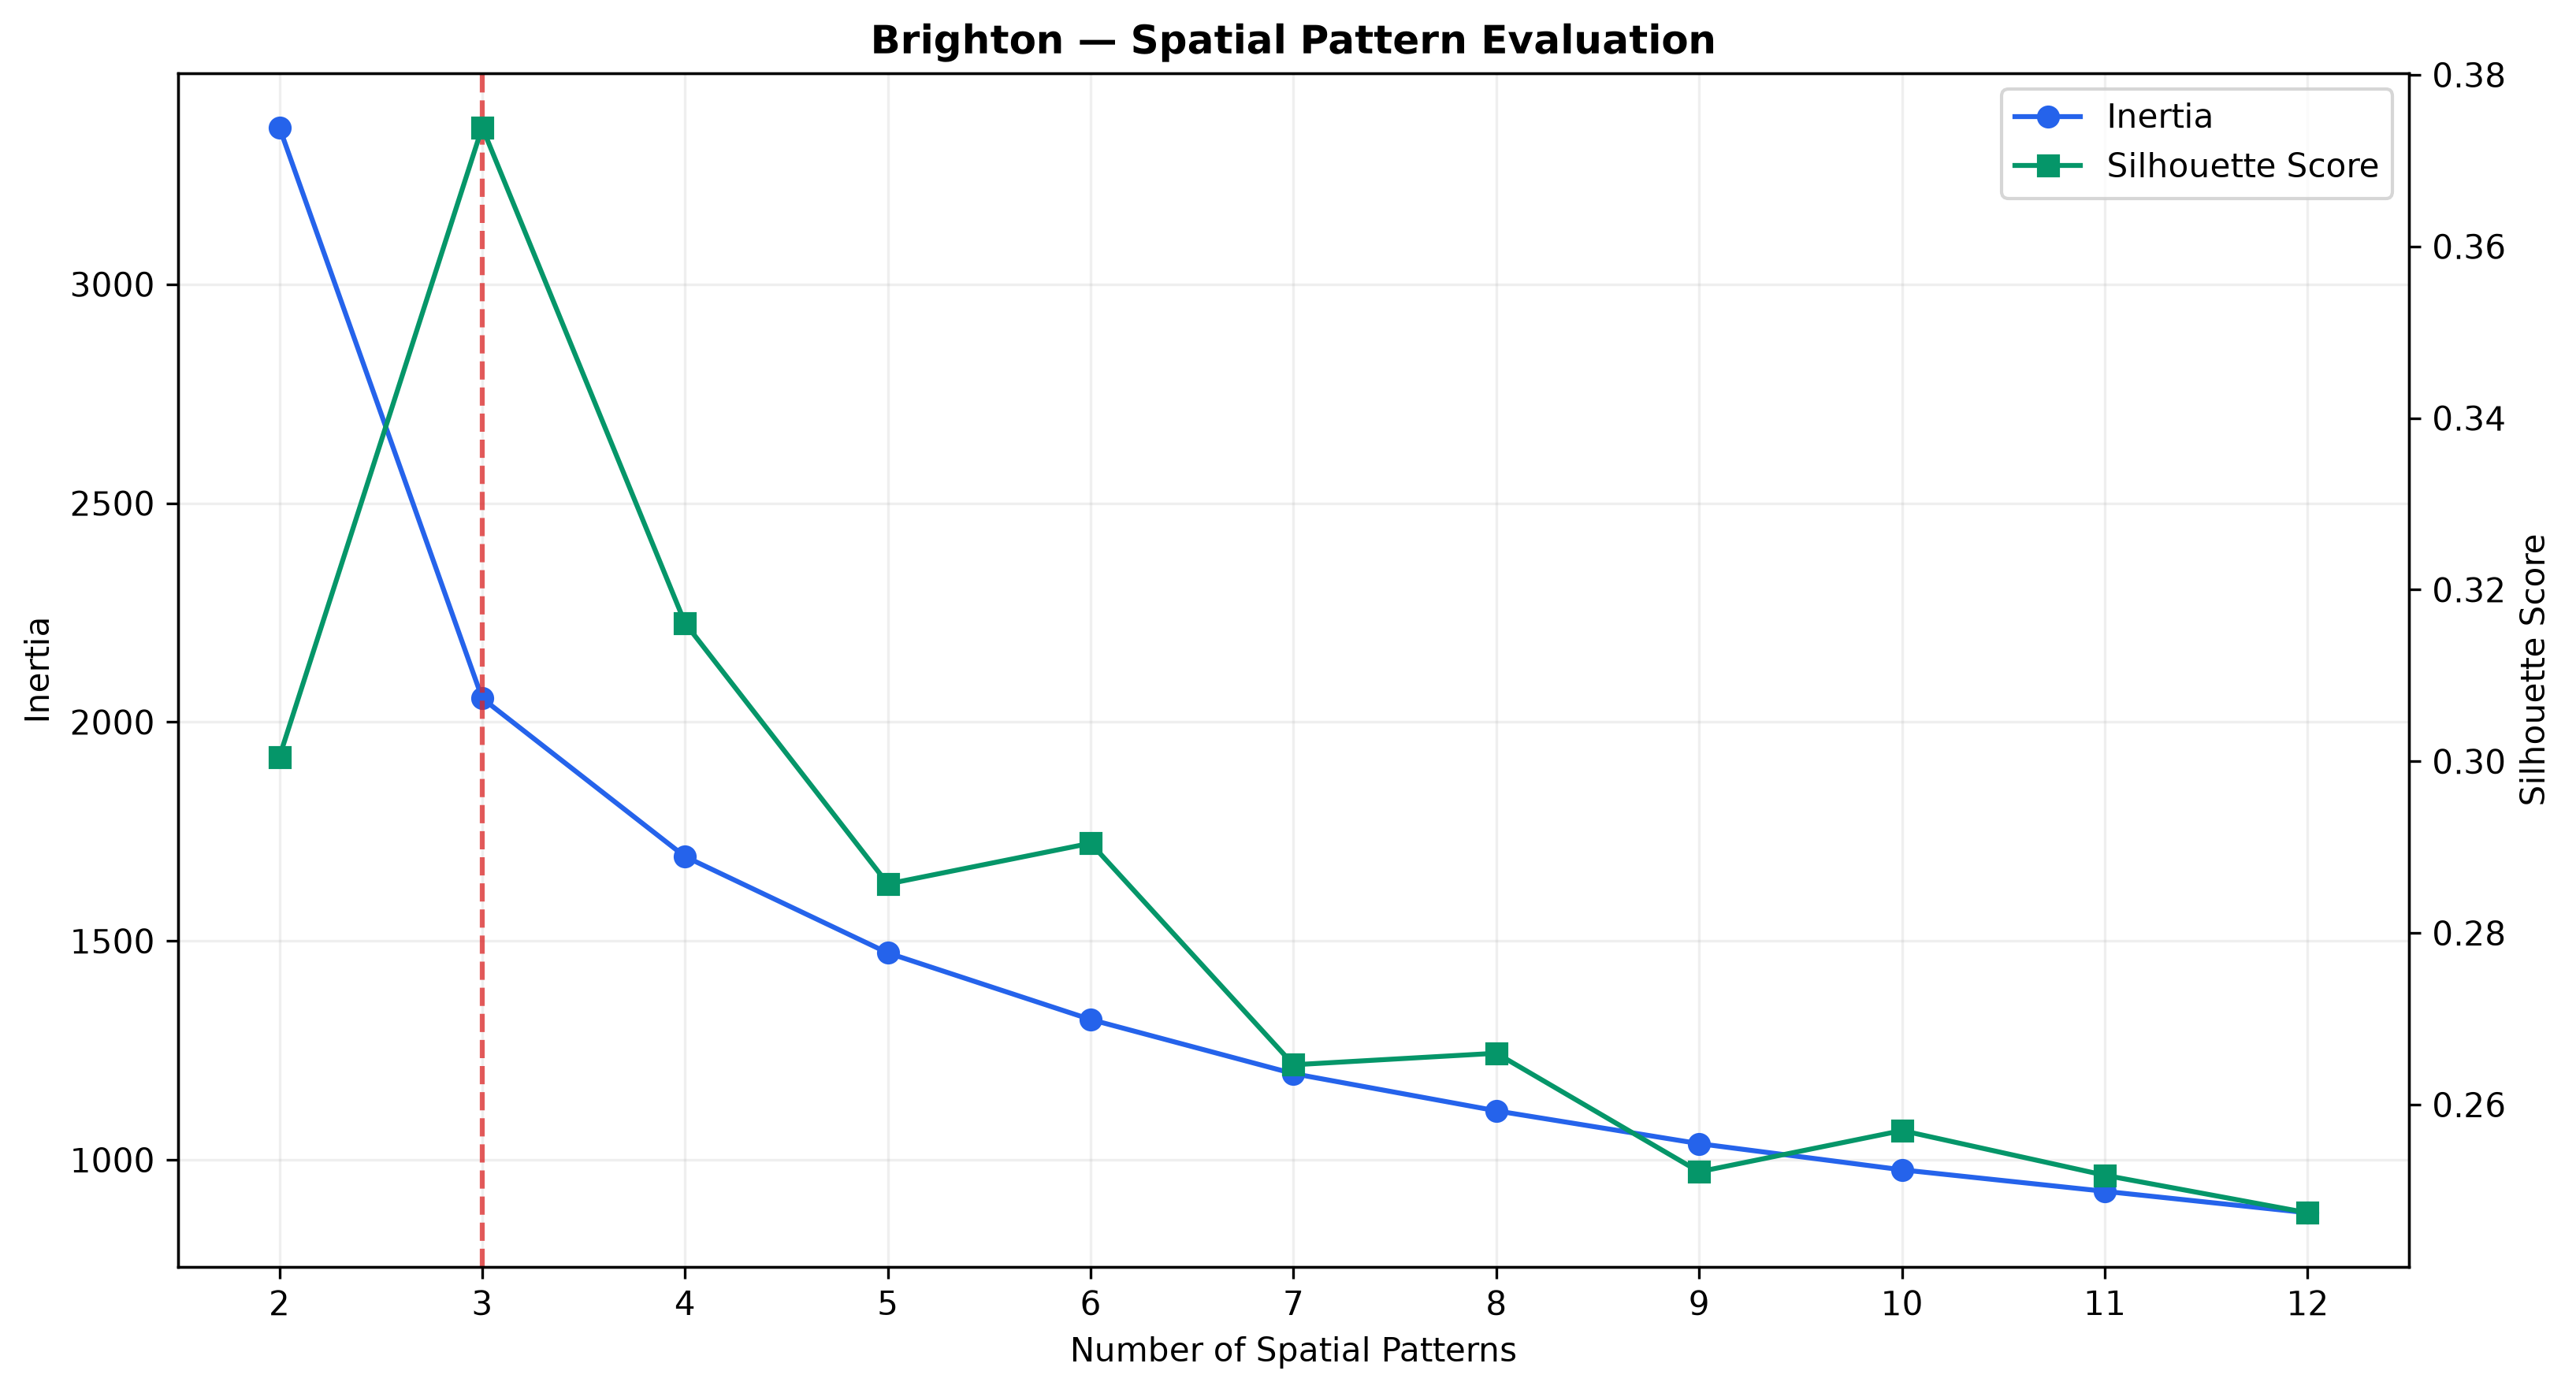
The three initial clusters were not automatically accepted as the final tactical interpretation. Their spatial distributions were examined further with DBSCAN, which helped distinguish concentrations supported by repeated activity from passes that were relatively isolated within the broader groups.
DBSCAN further divided the three initial spatial patterns into six more concentrated groups. Rather than presenting every subgroup, we selected those with substantial passing volume and consistent representation across matches. Three groups met these criteria, each appearing in all eight analyzed games.
We then applied selection criteria designed to emphasize patterns with substantial passing volume and meaningful representation across the sample. The same principle guided the selection of individual connections: a relationship needed to appear across a significant proportion of matches and contribute meaningfully to its corresponding spatial pattern. In particular, the featured connections recur in at least half of the eight matches.
This process ultimately produced three spatial groups suitable for closer examination: Pattern 1.1 with 426 passes, Pattern 2.1 with 388 passes, and Pattern 3.1 with 245 passes. All three appeared in every analyzed match. Other observations were not necessarily unimportant; they simply did not meet the same requirements for the final spatial presentation.
The distinction is essential. We are not arguing that Brighton has only three ways of circulating the ball. We are identifying three substantial, recurring spatial organizations within the set of passes associated with structurally critical connections.
Where Are Brighton’s Critical Passes Concentrated?
The next visualization shifts attention from individual clusters to the wider distribution of critical passing activity across the pitch.
Rather than simply counting where critical passes occur, the analysis compares their concentration with Brighton’s overall passing activity in each field zone. This distinction is particularly valuable because areas with many passes will naturally tend to contain many passes associated with important connections. A meaningful spatial comparison should therefore consider the proportion of critical passes relative to the amount of circulation taking place in the same area.
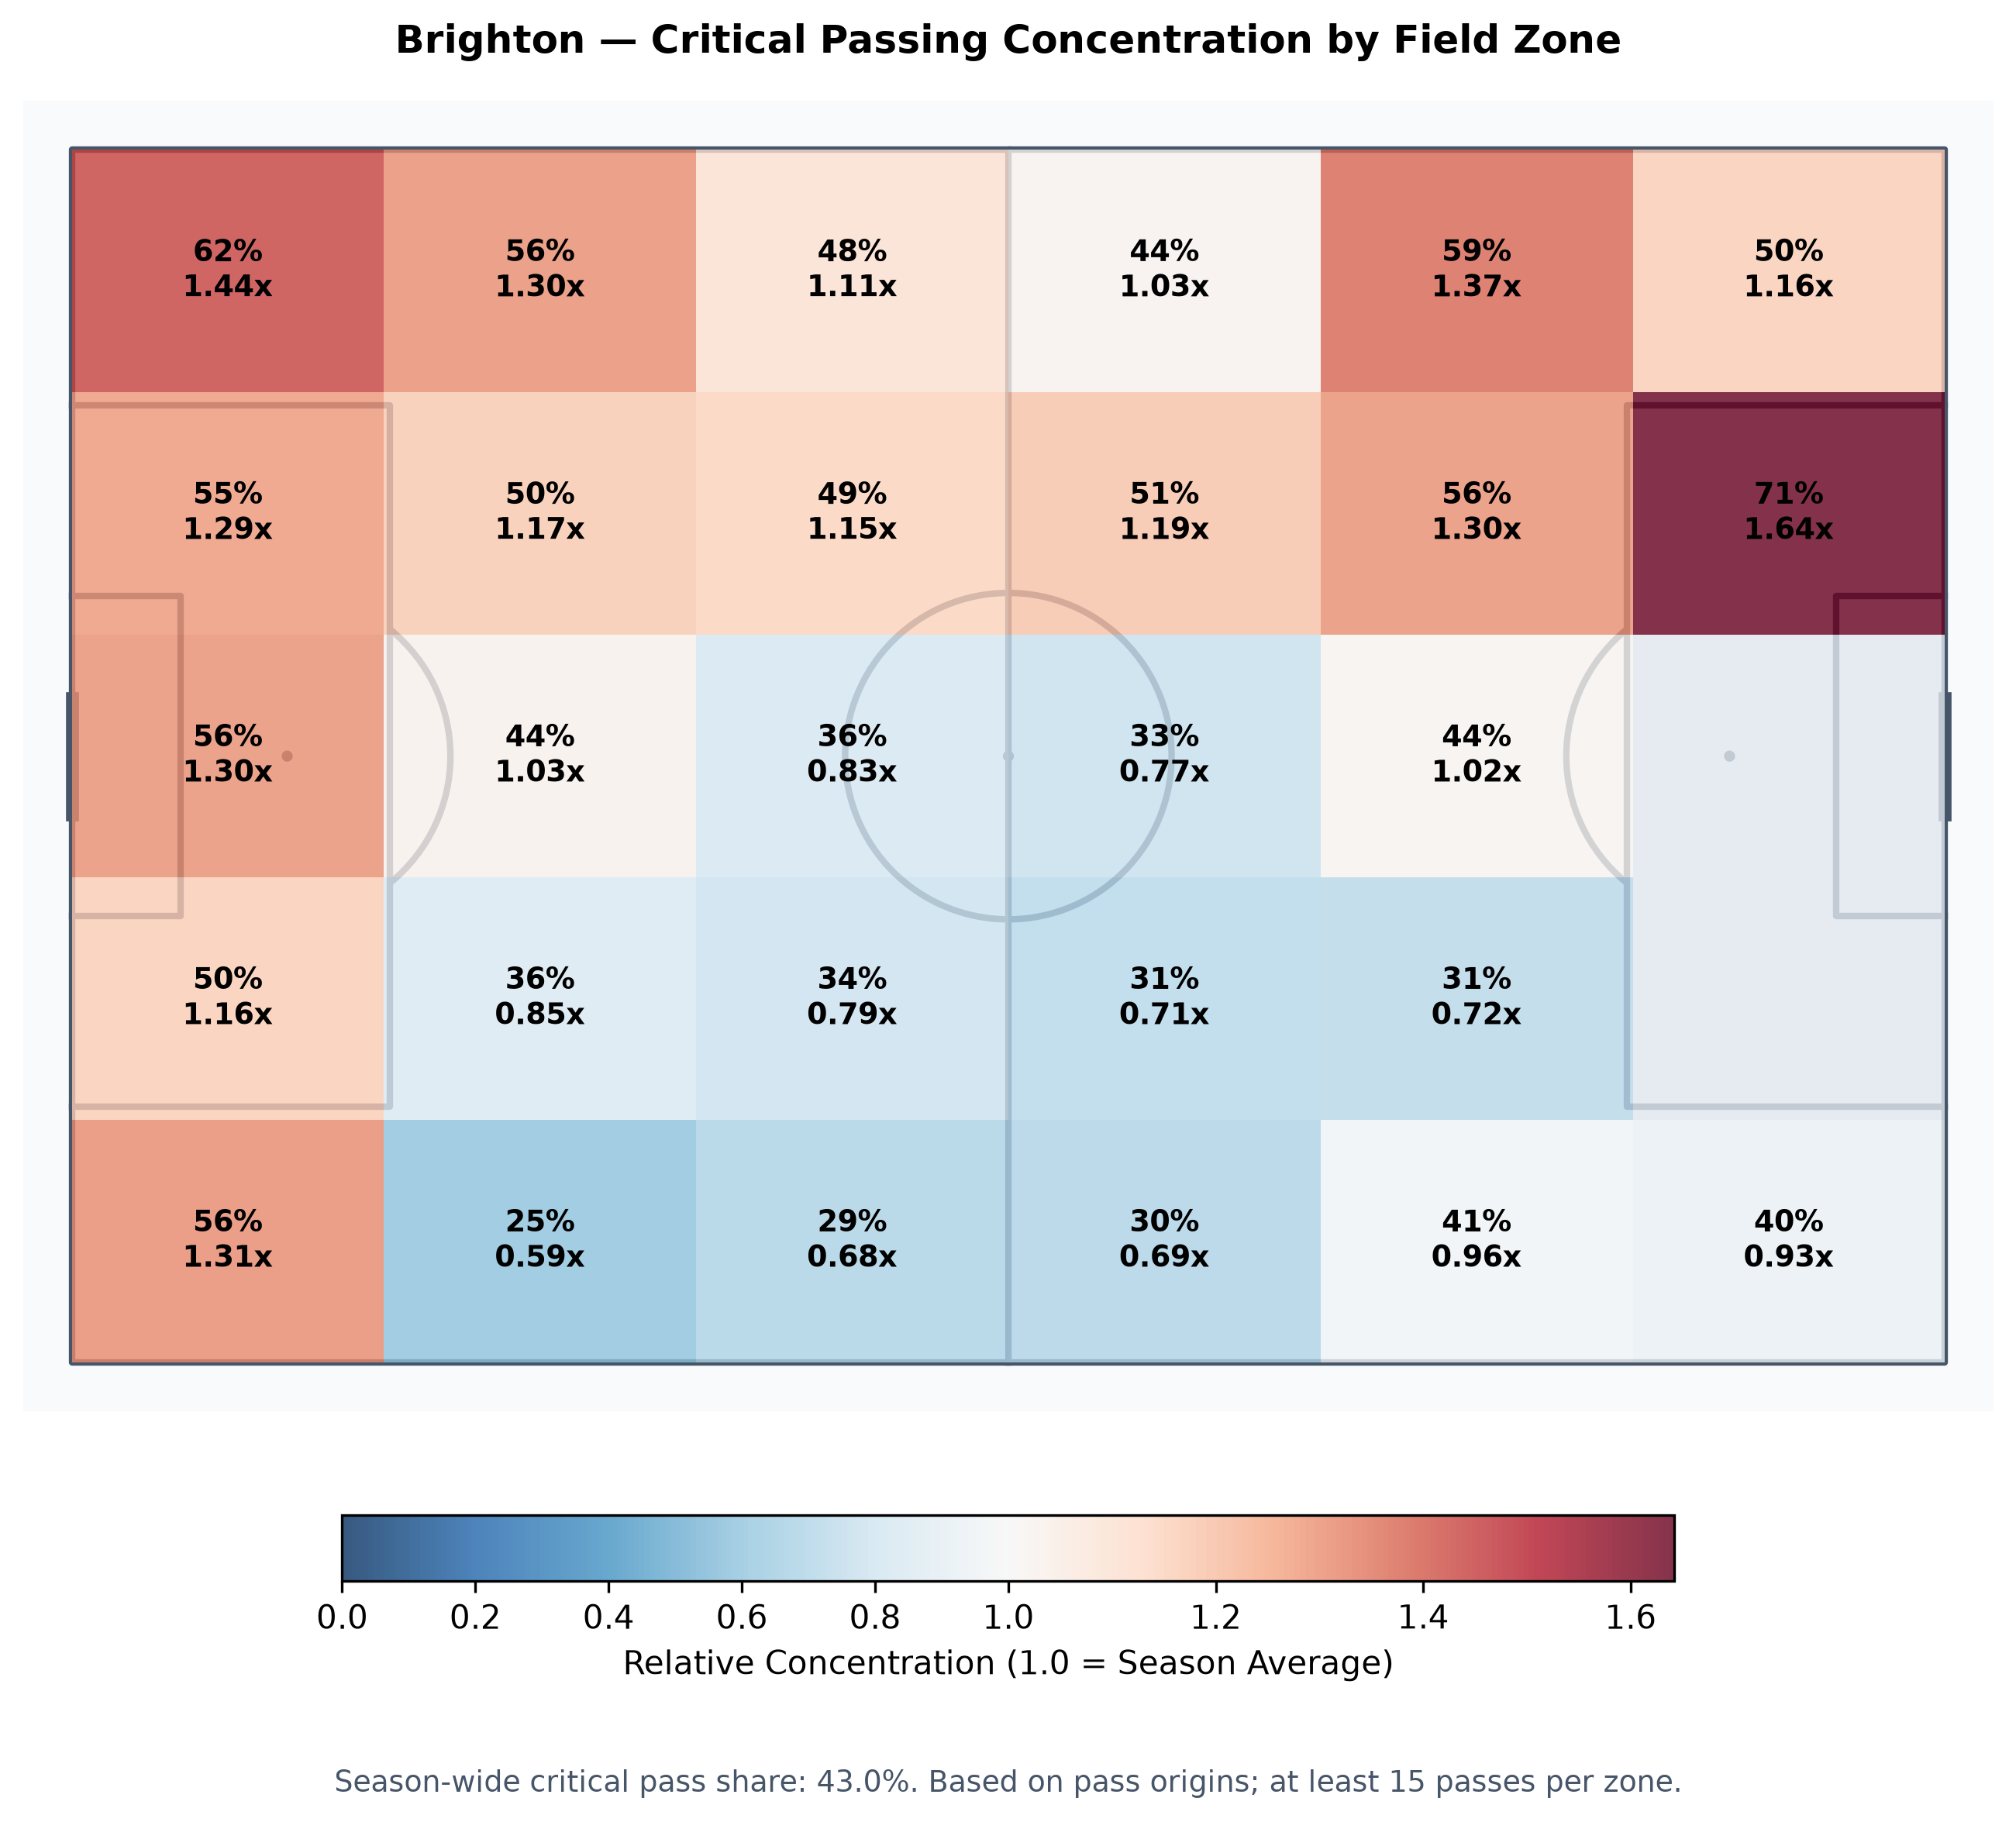
The analyzed sample produces an overall critical-pass share of 43.0%. In other words, a substantial proportion of the completed passes represented in the study belong to connections identified as structurally important during the network-removal analysis.
That percentage provides a useful reference point for interpreting the heatmap. A zone with a relative concentration above 1.0 contains a greater proportion of critical passing activity than the overall average, while a value below 1.0 indicates that critical connections account for a smaller share of local passing activity.
Some zones stand out considerably. One advanced wide area reaches a critical-pass share of 71%, corresponding to 1.64 times the overall average. Other zones register elevated concentrations around 1.30–1.44 times the baseline. Conversely, several central areas fall noticeably below the average, showing that the structural importance of passing activity is not distributed uniformly across the pitch.
These differences matter because the locations of critical connections can be as relevant as the identities of the players involved. An opposition team does not defend an abstract network. It defends spaces, passing lanes, receivers, and the movement that allows those relationships to emerge. Understanding which regions contain disproportionate concentrations of structurally important passes may help direct attention toward the areas where disruption could be most consequential.
Nevertheless, an important distinction remains: high spatial concentration does not automatically mean that a particular zone is more dangerous offensively. The heatmap describes structural importance within passing circulation, not the probability of scoring or the attacking value of individual passes. Its purpose is to reveal where the connections that help sustain network organization are disproportionately represented.
Three Recurring Patterns That Help Explain Brighton’s Structure
The three selected spatial patterns provide a more detailed interpretation of that wider picture. Each visualization combines a heatmap of passing origins, arrows representing average passing directions, and a table of recurring critical connections. The tables report passing volume, match recurrence, participation within the spatial pattern, and the accumulated loss of network efficiency associated with the removal of each connection.
The final column deserves particular attention. Summed Efficiency Loss measures the accumulated marginal reductions in global efficiency produced by a connection’s removal across the relevant matches, with each reduction expressed relative to that match’s initial efficiency. These values are expressed in percentage points and should not be interpreted as a single observed reduction in Brighton’s real-match performance.


Pattern 1.1: Lewis Dunk and the Central-Left Passing Structure
Pattern 1.1 contains 426 passes across all eight matches and reveals an important aspect of Lewis Dunk’s role in Brighton’s passing organization. The recurring connections selected within this pattern are Lewis Dunk → Olivier Boscagli and Lewis Dunk → Maxim De Cuyper, two relationships associated with the team’s central and left-sided circulation.
The connection from Dunk to Boscagli accounts for 46 passes across four matches, representing 10.8% of the pattern’s passing activity. Its accumulated efficiency loss is 2.00 percentage points. The connection from Dunk to De Cuyper contributes another 23 passes across five matches, representing 5.4% of the pattern, with a summed efficiency loss of 2.49 percentage points.
These numbers are interesting for two distinct reasons. First, Dunk is repeatedly involved in the selected structural relationships, suggesting that his importance is not restricted to isolated passing sequences. Second, the destinations of these connections point toward a relationship between his distribution and the preservation of options across central and left-sided areas.
Dunk’s role in this context should not be interpreted simply as that of a defender distributing the ball toward teammates. What matters is the connectivity created by those relationships. A pass can be short, sideways, or seemingly conservative and still maintain access to other players and potential routes through the network. From that perspective, circulation through Dunk may help sustain the structural conditions that allow the team to remain connected.
For an opposition analyst, the practical question becomes whether limiting these particular receiving options could force Brighton to reorganize the way it circulates possession. Preventing every pass from Dunk is neither realistic nor necessary. More relevant is understanding which of his passing relationships repeatedly occupy important positions in the network and when those relationships are most likely to emerge.
Pattern 2.1: Deeper Circulation and the Importance of Maintaining Alternatives
Pattern 2.1 contains 388 passes across the same eight matches, with its spatial distribution emphasizing deeper areas and the central-left side of Brighton’s passing organization.
Once again, Lewis Dunk appears prominently. His connection to Bart Verbruggen accounts for 36 passes across four matches, representing 9.3% of this pattern, with a summed efficiency loss of 2.00 percentage points. His relationship with Olivier Boscagli also appears, contributing 28 passes across four matches, or 7.2% of the pattern, with the same accumulated efficiency-loss value of 2.00 percentage points.
A third recurring connection involves Luka Vušković → Bart Verbruggen, with 25 passes across five matches, representing 6.4% of the pattern and producing an accumulated efficiency loss of approximately 2.50 percentage points.
The presence of goalkeeper-directed connections is particularly important to the interpretation. A goalkeeper is not merely the final destination of a defensive pass; he can be an integral part of the passing network, providing an additional route through which players remain connected. Returning possession toward the goalkeeper may preserve a circulation option, facilitate a change of direction, or allow the structure to reorganize rather than commit immediately to a contested forward route.
Pattern 2.1 therefore reinforces the importance of structural support relationships. It also illustrates why the simple volume of progressive passes would provide an incomplete picture of the team’s organization. Some connections are valuable precisely because they preserve alternatives.
There is also an important methodological distinction concerning Dunk’s relationship with Boscagli. The same directed connection appears in both Patterns 1.1 and 2.1. Its structural removal impact belongs to the underlying player-to-player relationship and may be represented in more than one spatial pattern. The repeated 2.00-point value should therefore not be added together as though it represented two separate losses. What the two patterns reveal is that the same important relationship can be expressed across different spatial situations.
This is valuable tactical information in itself. An opponent trying to interfere with Brighton’s organization must recognize that a recurring connection may remain structurally relevant even when its location or immediate passing context changes.
Pattern 3.1: Diego Gómez and the Right-Sided Structural Connection
Pattern 3.1 produces perhaps the most striking individual finding of the study. Its 245 passes, represented across all eight matches, form a distinct spatial concentration associated with Brighton’s right-sided circulation. Unlike the preceding patterns, where Lewis Dunk dominates the selected relationships, the two recurring connections here originate with Diego Gómez.
The first is Diego Gómez → Pascal Groß, with 14 passes across four matches and a 5.7% share of the pattern. The second is Diego Gómez → Luka Vušković, with seven passes across four matches and a 2.9% share.
The most significant distinction appears in the structural-impact results. Removing the Gómez → Groß connection produces a summed efficiency loss of 5.68 percentage points, the highest accumulated value among the recurring connections featured in these three patterns. The Gómez → Vušković relationship produces a smaller, but still notable, accumulated loss of 2.02 percentage points.
This result deserves particular attention. The Gómez → Groß connection does not have the highest passing frequency in the selected tables. Indeed, it involves substantially fewer passes than several relationships associated with Lewis Dunk. Yet its accumulated structural impact is greater.
That contrast illustrates one of the central motivations behind this analysis: passing frequency and structural importance are not the same thing.
A connection may occur relatively infrequently and still be highly consequential because of the position it occupies within the network. If that relationship helps link areas or players that would otherwise require longer alternative routes, removing it can produce a meaningful reduction in global efficiency. The importance lies in the structure of the available connections, not simply in the number of times a pass is completed.
The Gómez → Groß relationship therefore emerges as a particularly interesting target for further tactical observation. Its location on the right, its recurrence across matches, and its comparatively large accumulated efficiency loss suggest a connection that deserves attention when evaluating how Brighton maintains its circulation in that region.
This does not mean Gómez is universally more important than Dunk, nor that a single connection determines Brighton’s performance. The observed losses are associated with particular removal steps and match-specific networks. Nevertheless, the contrast between Dunk’s central-left influence and Gómez’s right-sided influence suggests that Brighton’s structural dependence may be distributed geographically rather than concentrated around one player.
How Can an Opponent Disrupt Brighton’s Passing Game?
The practical value of these findings becomes clearer when we consider the perspective of a team preparing to face Brighton.
Suppose an opposition analyst wants to identify which passing relationships are worth disrupting. A conventional approach might prioritize the most frequent passers, the players with the greatest attacking output, or the zones where Brighton tends to progress the ball. Those are legitimate considerations, but the present study offers another layer: it identifies relationships whose removal reduces the structural efficiency of the team’s passing network.
Based on these eight matches, Lewis Dunk and Diego Gómez emerge as two players whose recurring connections deserve particular attention—but in different areas of the pitch.
In the central and left-sided regions, the opposition could pay closer attention to Dunk’s connections with Boscagli, De Cuyper, and Verbruggen. The tactical objective would not necessarily be to pressure Dunk continuously, which could create space elsewhere, but to examine when his preferred receiving options become available and how their positioning helps preserve Brighton’s passing routes.
An opposition team might investigate whether its pressing structure can narrow the angles toward these receivers, discourage circulation through the relevant lanes, or encourage the ball to move toward areas where Brighton has fewer immediately available connections. The goal would be to make the team’s normal circulation more difficult without sacrificing the collective organization of the defending side.
On the right, the relationship between Diego Gómez and Pascal Groß deserves particular consideration. Its 5.68-point accumulated efficiency loss suggests that the connection has an important structural role in the analyzed sample. An opponent could examine whether coordinated pressure on Gómez, combined with positional control of the passing lane toward Groß, might limit Brighton’s access to one of its more consequential right-sided relationships.
Such an approach would need to be coordinated. Simply marking Gómez more aggressively might open another passing option, and preventing the direct connection to Groß could cause Brighton to circulate possession through a different player. In football, the behavior of the network is not fixed: players move, opponents react, and coaches adjust their positioning. The value of the analysis is therefore not in prescribing an inflexible defensive instruction, but in identifying a specific relationship that merits investigation during opposition scouting.
The same principle applies to Dunk. If he is important to the structural organization of the central and left-sided passing network, a coach may ask how best to influence the conditions under which those connections occur. Is it preferable to restrict the receiving options? To control the space behind the potential receiver? To encourage an alternative passing direction? Or to use the opponent’s own pressing movement to create a temporary interruption in Brighton’s preferred circulation?
These questions cannot be answered definitively by the network analysis alone. They require video observation, an understanding of players’ positioning, and consideration of the opponent’s defensive capabilities. However, the data provide a starting point that is considerably more specific than simply identifying Brighton’s most active passers.
The broader tactical lesson is that disrupting a team’s passing structure does not always require winning the ball immediately. Sometimes the first objective is to make the network operate less efficiently: reduce the availability of a recurring connection, force the ball toward a different receiver, or require additional passes to connect areas that normally communicate more directly.
That is the distinction between defending an individual action and attempting to disturb the underlying organization of a team.
What This Study Reveals About Brighton—and the Value of Network Analysis
The most important conclusion from this experiment is not simply that Lewis Dunk and Diego Gómez appear in the tables of structurally critical passing relationships. It is that their importance is expressed through different spatial patterns, and that the resulting network-efficiency losses provide a way of distinguishing the structural relevance of those relationships from their frequency.
Dunk repeatedly appears in connections associated with central, left-sided, and deeper circulation, helping preserve important routes between players. Gómez, meanwhile, emerges as a notable structural reference on the right, with his connection to Pascal Groß producing the largest accumulated efficiency loss among the relationships highlighted in the selected patterns.
These findings do not establish that Brighton can be neutralized by stopping two players. They demonstrate something more precise: within the eight matches examined, certain recurring player-to-player connections occupy important structural positions, and their passing activity is not distributed randomly across the field. There are recognizable spatial tendencies that an opposition analyst can investigate.
At the same time, the broader vulnerability analysis indicates that Brighton possesses alternative passing routes and does not lose its entire connectivity after the removal of just a few important relationships. This makes the tactical challenge more interesting. The objective for an opponent is not to imagine that one blocked pass will dismantle the whole system, but to understand which combinations of restricted connections might force Brighton to reorganize its circulation.
The distinction between structural importance and attacking value is also worth preserving. A network can identify connections that sustain access between players without claiming those passes are individually dangerous. A backward pass to the goalkeeper, a short central exchange, or a lateral connection can be important because of the alternatives it preserves. Ignoring these actions would mean overlooking an essential component of collective organization.
For football analysts, scouts, and coaching staffs, this creates an opportunity to look beyond familiar passing statistics. Instead of asking only which players complete the most passes or advance the ball most effectively, we can investigate how their relationships support the wider system, where those relationships tend to occur, and which of them may be particularly sensitive to disruption.
Football is not simply a sequence of individual actions. It is also a network of relationships that gives those actions their collective meaning.
Understanding which relationships hold that network together may help us understand not only how a team plays, but also where an opponent should begin looking if it wants to make that team play differently.
Football Hacking — Football Analytics, Network Science & Tactical Intelligence