
Building a Football Pass Network Health Analyzer: A New Interactive Tool for Structural Match Analysis
A New Football Analysis Project Focused on Structural Quality, Spatial Control, and Pass Network Health

One of the biggest problems in modern football analysis is that most metrics explain what happened, but not necessarily why the structure of the game evolved the way it did.
Possession percentages.
Shots.
xG.
Touches in the box.
Dangerous attacks.
These metrics are useful, but they often fail to explain how the organization of a team changes throughout the match.
That is exactly the problem I’m currently trying to solve with a new Football Hacking project.
I’ve been developing an interactive football analysis web app focused on:
pass network health,
structural efficiency,
spatial occupation,
and temporal changes in team organization.
The idea is not to create another generic dashboard full of disconnected numbers.
The goal is to create a tool that helps analysts visually identify:
when a team’s structure starts deteriorating,
where circulation becomes unstable,
and how the positioning of passes changes during specific moments of the match.
The project is still under development, but the core concepts are already becoming extremely promising.
Why I Started Building This Project
One thing I’ve noticed repeatedly while analyzing matches is that structural deterioration often appears before the traditional metrics react.
A team may still have:
decent possession,
acceptable pass completion,
or even balanced xG,
while its pass network is already becoming unstable.
You can often see:
disconnected players,
overloaded corridors,
isolated support structures,
reduced spacing quality,
or inefficient circulation patterns
long before the scoreboard changes.
This project was born from the desire to visualize those moments more clearly.
Instead of looking only at final outputs,
I wanted to analyze:
the health of the structure itself.
What Is Pass Network Health?
The central idea behind the app is a concept I call pass network health.
The objective is to measure how stable, connected, and functional a team’s passing structure is during different moments of the match.
The model does not simply reward possession volume.
A team circulating the ball endlessly without meaningful progression should not necessarily be considered structurally healthy.
Instead, the analysis attempts to combine:
connectivity,
circulation quality,
spatial distribution,
support relationships,
and progression efficiency.
The result is a more contextual understanding of how organized the team actually is.
Why Full-Match Statistics Are Often Misleading
One of the major limitations of traditional football statistics is aggregation.
Football is highly dynamic.
The first 15 minutes may look completely different from:
the final 20 minutes,
the post-substitution phase,
or the period immediately after conceding a goal.
When everything gets compressed into one final number,
important structural transitions disappear.
That is why the app was designed around temporal windows.
Instead of evaluating only the entire match,
the analyst can isolate:
specific intervals,
tactical phases,
momentum shifts,
or structural collapses.
This creates a much more detailed reading of the game.
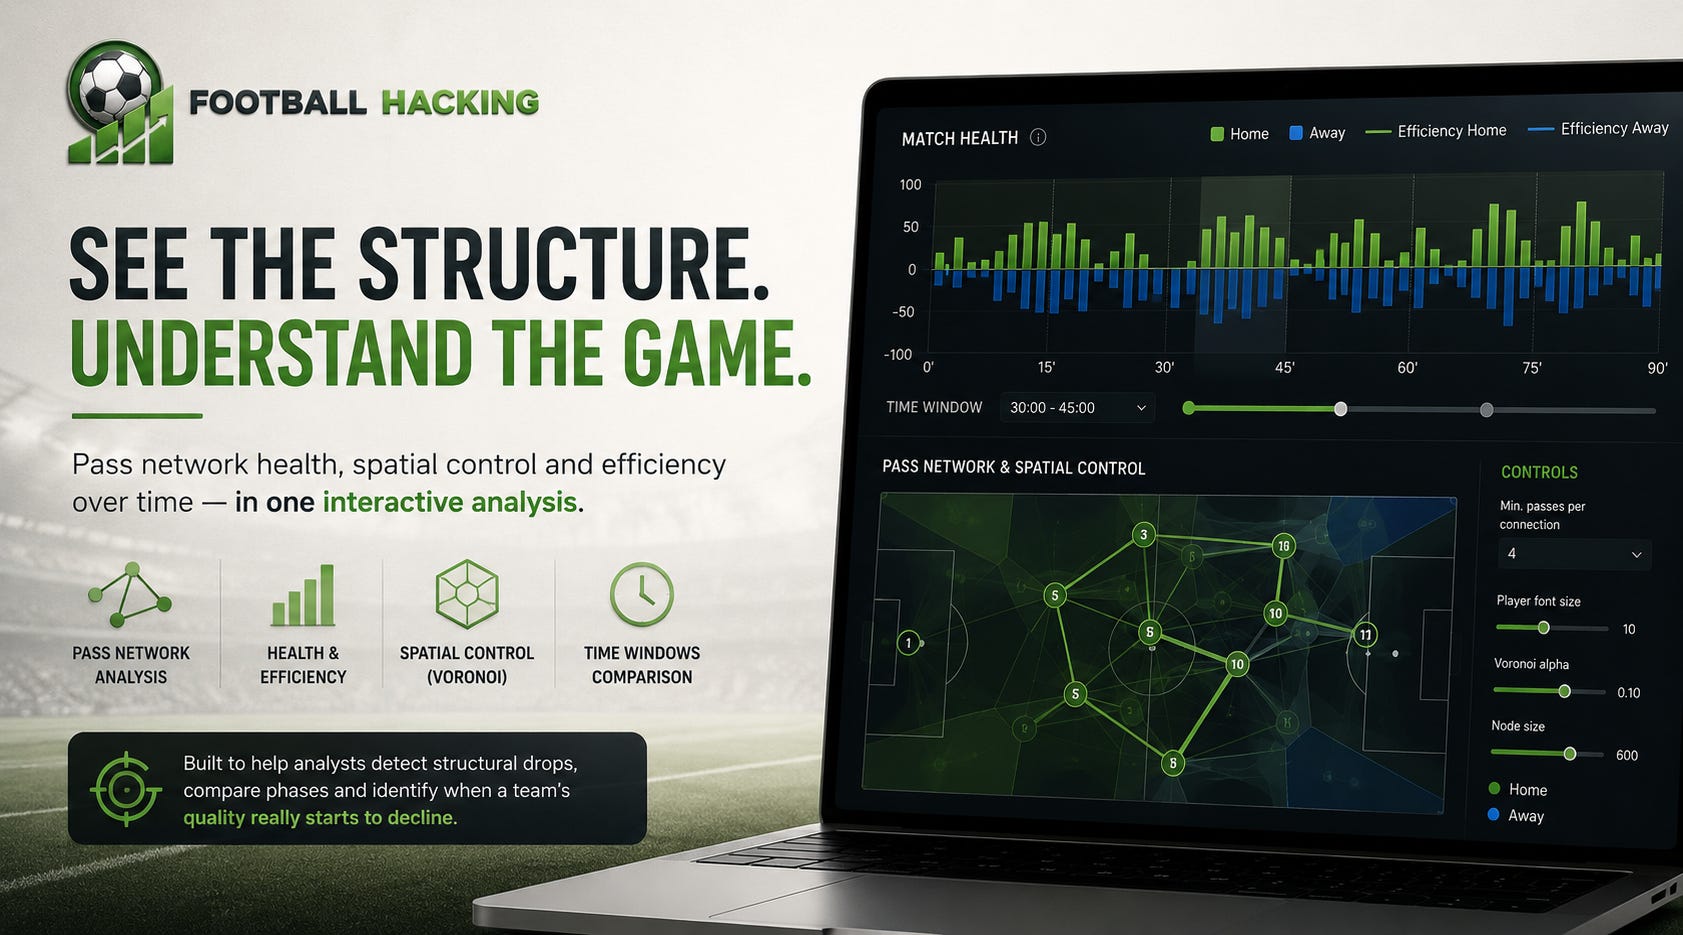
The Interactive Match Health Timeline
One of the core visual components of the app is an interactive health timeline.
The visualization displays:
upward bars for the home team,
downward bars for the away team,
and efficiency backgrounds for each side independently.
The bars represent the structural health of the network during each time window.
The background intensity reflects the efficiency of the network during that same phase.
This creates an immediate visual contrast between:
organization,
and productive progression.
A team may:
maintain decent structure,
but lose efficiency.
Or:
create efficient progression moments,
while operating with unstable spacing and fragile circulation.
That distinction matters enormously in tactical analysis.
Why Efficiency and Structural Health Are Not the Same Thing
One of the most interesting discoveries during development is how often:
efficiency,
and structural stability
move independently.
A team can create dangerous attacks while operating with poor structural organization.
Another team may circulate possession extremely well while failing to generate meaningful progression.
Traditional statistics frequently merge these ideas together.
This project tries to separate them.
That separation is crucial because:
tactical sustainability matters,
not just isolated attacking moments.
Interactive Pass Networks by Match Window
Below the health chart, the app generates interactive pass networks for the selected time interval.
This is where the project becomes particularly interesting.
Instead of looking at:
a full-match network,
or a static average positioning map,
the analyst can inspect:
very specific moments of the game.
For example:
the first 15 minutes,
the phase after a substitution,
the period immediately after a goal,
or the final defensive phase protecting a lead.
This dramatically improves contextual understanding.
Why Spatial Context Matters
The pass network is combined with Voronoi spatial visualization.
The Voronoi layer is intentionally subtle and low-opacity.
Its purpose is not visual decoration.
It helps reveal:
occupation balance,
territorial distribution,
and spacing relationships.
A team may complete many passes while occupying space poorly.
Another team may create fewer passes but maintain excellent positional organization.
The combination of:
pass connections,
player positioning,
and spatial influence
helps expose these differences much more clearly.
Removing Noise From the Visualization
One of the biggest challenges in pass network visualization is avoiding noise.
Football event data contains:
set pieces,
dead-ball situations,
and many low-value connections.
Including all of them creates chaotic visualizations that are difficult to interpret.
That is why the app filters:
open-play passes only,
while allowing analysts to define minimum pass thresholds for connections.
Importantly:
all active players remain visible,
while only weak connections are filtered.
This keeps the structural shape intact while reducing unnecessary clutter.
Handling Substitutions Correctly
Another problem with many pass network visualizations is substitution handling.
Most systems:
abruptly replace players,
or create distorted overlaps during transitional periods.
The app handles substitutions dynamically.
For each selected window:
the system calculates which player occupied the role for the longest period.
If the timing is tied,
priority is given to the substituted player to preserve continuity between windows.
This creates much cleaner and more interpretable structures.
Especially during:
second-half tactical shifts,
pressing adjustments,
and fatigue phases.
Standardizing Directional Interpretation
One subtle but important feature of the project is directional normalization.
The home team always attacks:
from left to right.
The away team always attacks:
from right to left.
This may sound simple, but it significantly improves readability.
Without directional consistency,
network interpretation becomes mentally exhausting.
The system automatically adjusts positioning coordinates to preserve intuitive tactical interpretation.
Why This Could Be Useful for Tactical Analysts
The primary objective of this project is not aesthetics.
It is tactical readability.
The app aims to help analysts identify:
structural instability,
progression bottlenecks,
disconnected support structures,
overloaded corridors,
and circulation breakdowns
much faster than traditional event analysis.
Instead of manually scanning hundreds of passes,
analysts can isolate problematic phases visually.
This can potentially accelerate:
tactical reporting,
post-match analysis,
opponent analysis,
and educational workflows.
Potential Applications Beyond Post-Match Analysis
Although the project is still under development,
the long-term potential is extremely interesting.
Structural changes often emerge before:
large xG swings,
dangerous shot sequences,
or scoreboard changes.
This opens possibilities for:
live tactical monitoring,
structural momentum interpretation,
and even trading-oriented football analysis.
The idea is not simply predicting outcomes.
The idea is understanding how the match structure evolves.
The Philosophy Behind the Project
Football is not just a sequence of isolated events.
It is:
relational,
spatial,
dynamic,
and contextual.
That philosophy is driving this entire project.
Instead of focusing exclusively on:
outcomes,
or event accumulation,
the app tries to analyze:
how teams sustain structure,
how they organize space,
and how they maintain progression quality under pressure.
That is where many tactical truths actually emerge.
What Comes Next
The project is still evolving.
Future ideas may include:
live updating structures,
pressure overlays,
progression corridor diagnostics,
defensive influence layers,
automated tactical summaries,
and structural alerts.
The current version is already helping me visualize matches differently.
But there is still a lot to improve.
And honestly, that is part of the fun.
Final Thoughts
Most football dashboards explain:
what happened.
This project is trying to explain:
how the structure evolved before it happened.
By combining:
pass network health,
efficiency tracking,
temporal windows,
spatial occupation,
and interactive network visualization,
the app creates a much more contextual reading of football matches.
And in modern football analysis, understanding structural evolution may be one of the most valuable edges available.
Try the Football Hacking Web App
This structural pass network project is still under development, but you can already explore another side of Football Hacking through the web app.
Inside the Football Hacking App, you can find fair odds and match probabilities generated through Poisson models, Dixon-Coles adjustments, and Monte Carlo simulations.
It is built to help users compare market prices with model-based probabilities and identify where the betting market may be overpricing or underpricing a team.
Explore the app here:
The long-term objective is to connect both worlds: probabilistic match modeling and structural football analysis.
Because football decisions become stronger when we understand not only the expected scoreline, but also how teams actually behave on the pitch.