

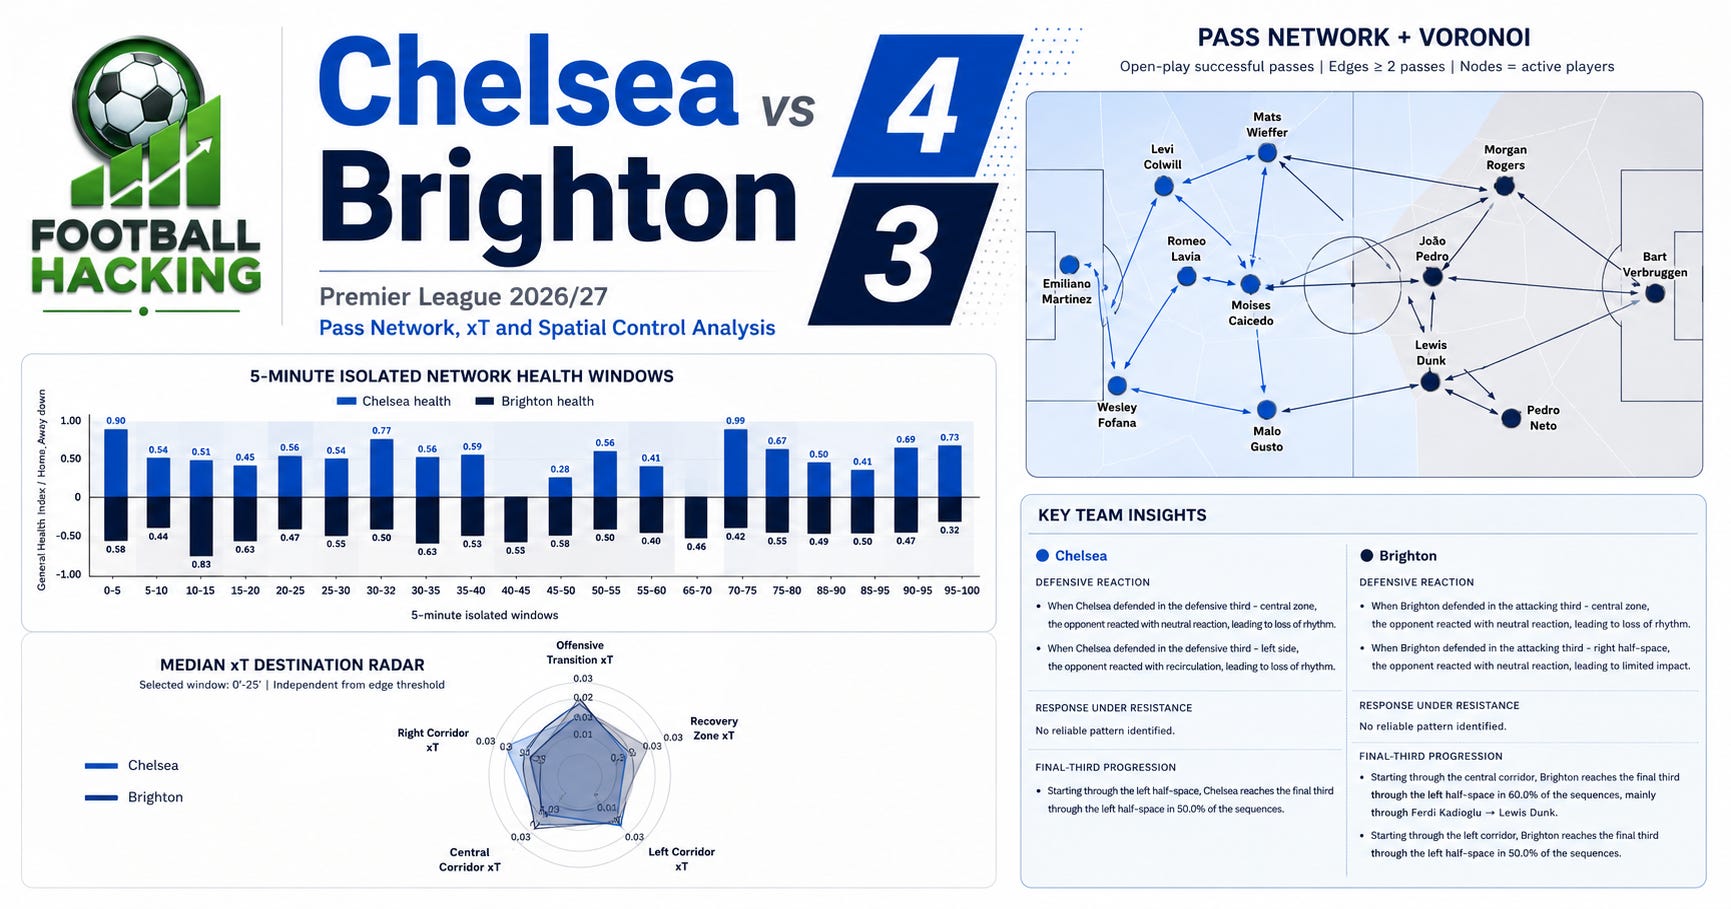
Disclaimer: No match images or video footage were used in this analysis. The conclusions are based exclusively on event data, pass-network structure, Voronoi spatial control, Median xT Destination, corridor xT, Network Health and Football Hacking Match Diagnostics.
Chelsea and Brighton controlled very different parts of the match in very different ways. At the end of this analysis, the full match-events xlsx will also be available to download for paid subscribers.
Chelsea’s direct efficiency overcame Brighton’s territorial circulation in a match that changed shape repeatedly
Chelsea’s 4–3 win over Brighton in Premier League 2026/27 Round 2 is a good example of why territorial control, passing control and attacking efficiency are not the same thing.
Brighton frequently established the more elaborate circulation structure, particularly through central areas and the left half-space. Chelsea, however, repeatedly found ways to turn much shorter periods of control into decisive attacking actions.
The match-event data reinforces that contrast. Chelsea were already 2–0 ahead by the 13th minute, with goals from Roméo Lavia and Pedro Neto, before João Pedro made it 3–0 at 31 minutes. Brighton responded through Malick Yalcouyé at 34’.
0’–25’: Brighton had structure, Chelsea had damage
The opening network already explains much of the game.
Brighton occupied a broad central structure with multiple connections around midfield, while Chelsea were less interested in building a perfectly symmetrical possession network. The Blues’ attacks were more vertical and selective.
The key areas for Chelsea were the central channel and the right side of the attacking structure, where Cole Palmer and Malo Gusto helped stretch Brighton’s defensive occupation. Chelsea did not need permanent territorial domination to create danger.
That difference matters because the Network Health chart shows something more nuanced than the score. Brighton still recorded substantial structural health during several opening windows despite conceding early. Chelsea’s effectiveness came from converting favourable moments rather than simply owning every phase.
In other words: Brighton could have the ball structure without having control of the consequences.
25’–45’: Chelsea’s right side becomes much more threatening
The second window produces one of the clearest changes in the entire match.
Chelsea’s right-corridor xT expands sharply, while the left corridor also remains productive. The passing map simultaneously shows a wider attacking occupation.
This is where Jorrel Hato and João Pedro become especially relevant. At 31’, the event data records Hato’s successful central pass as part of a FastBreak, immediately preceding João Pedro’s goal from the central area of the box.
That sequence captures Chelsea’s first-half approach almost perfectly: the team did not require a long possession chain to manufacture high-value progression.
Brighton, meanwhile, continued to find routes through midfield and the left side. The Match Diagnostics identifies a particularly clear tendency: when Brighton started through the central corridor, 60% of their final-third progressions arrived through the left half-space, with the Ferdi Kadioglu–Lewis Dunk connection highlighted as the main pathway.
So Brighton were not without a plan. The problem was that Chelsea were converting transitions faster than Brighton could turn territorial organisation into defensive security.


45’–70’: the match becomes less stable
The beginning of the second half changes the geometry.
Chelsea no longer appear as consistently expansive as they did late in the first half. Brighton occupy larger areas of the pitch and their network becomes more capable of sustaining possession around midfield.
Yet this is also where the Network Health chart needs to be interpreted carefully.
Chelsea reach an exceptional 0.99 Network Health reading in the 60’–65’ window, but the next major scoring event is actually damaging to them: the match file identifies the 65’ event as a João Pedro own goal from a corner, reducing Chelsea’s advantage.
That is an important reminder of what Network Health represents. It measures structural conditions; it does not claim that the structurally healthier team must score next.
Football can punish a team during a perfectly reasonable structural phase.
At 3–2, the game had suddenly reopened.
70’–100’: Chelsea change the route to goal
The final xT radar is perhaps the most revealing of the four windows.
Chelsea’s Offensive Transition xT rises strongly, while the central corridor becomes the dominant source of destination value. This is different from the stronger right-corridor emphasis seen earlier.
The passing network also becomes more selective. Chelsea are no longer trying to occupy every attacking lane with the same intensity. They increasingly look for the moment when a wide or half-space action can be converted into a central attack.
The fourth goal is a perfect data-level example.
At 76’, João Pedro plays from the right-side zone before Cole Palmer scores from the central area outside the box. The event file records the pass as a key pass and Palmer’s finish as an OutOfBoxCentre goal.
That sequence matches what the radar is showing: progression from a lateral area, value concentrated centrally.
Brighton still refused to disappear. Pascal Groß eventually scored with a header from the centre of the box at 98’, bringing the final score to 4–3.
Spatial control explains why this was never a simple Chelsea domination
The Voronoi maps are probably the best antidote to reading 4–3 as a conventional home-team victory.
Chelsea repeatedly controlled strategically useful pieces of the pitch without controlling the entire pitch.
Brighton often retained meaningful territorial presence around the centre and their build-up zones. Chelsea were more dangerous when the structure opened and the game could be moved rapidly toward the final third.
The defensive diagnostics support that interpretation. When Chelsea defended the central zone of their defensive third, Brighton frequently reacted neutrally and lost rhythm. When Chelsea defended the left side of their defensive third, Brighton tended toward recirculation, again reducing attacking rhythm.
That means Chelsea’s control was partly behavioural rather than purely territorial: they could allow Brighton to retain circulation while influencing where that circulation eventually went.
What Chelsea 4–3 Brighton tells us
This was not a match where one team simply controlled possession and therefore controlled the game.
Brighton were capable of sustaining an interconnected passing structure and repeatedly entering advanced areas through recognisable routes. Chelsea were much more opportunistic.
Across the approximately 20-minute windows, the progression is clear:
early efficiency → stronger right-side threat → second-half instability → greater transition and central-corridor value late in the game.
That changing attacking profile is probably the most important tactical feature of Chelsea’s performance.
Chelsea did not win because their network looked superior in every phase. They won because their structure could change its route to danger as the match changed around it.
Explore the full match inside the Football Hacking Web App
The Football Hacking Web App lets you go beyond the final score with interactive pass networks, Voronoi spatial control, xT by corridor, Network Health, tactical diagnostics, Poisson models, match probabilities and fair odds — allowing the same match to be explored across different minute ranges rather than through a single static snapshot.
Paid subscribers can continue below the paywall and download the complete Chelsea vs Brighton match-events xlsx used in this analysis. The file contains the underlying event-level data, giving you the possibility to reproduce the analysis, build your own metrics or explore entirely different questions from the same match.