

Paid subscribers can download the spreadsheets used as the basis for this article.
A team’s passing style is easy to describe in broad terms. We might call a side patient, direct, possession-heavy or dependent on a playmaker. Those descriptions can be useful, but they can also flatten very different behaviours into the same label. Two teams may both keep the ball, for example, while distributing the work of circulation in completely different ways. One may rely on a small number of players to connect its passing network. Another may involve more players in moving the ball forward.
I wanted to explore that difference using two measures: Load Gini and final-third pass share. The first helps describe how evenly passing responsibility is distributed across a team’s network. The second measures what share of a team’s passes reach the final third. I used KMeans clustering to group 150 teams from eight European leagues according to their values on those two measures, then connected the resulting profiles to the outcomes in 438 matches.
The project is an early-season investigation, not a completed study. Some clubs have played only a handful of league matches, and some profile matchups have very few observations. Still, the first picture is useful. It gives us a way to compare teams beyond league standings, identify interesting differences between competitions, and ask more precise questions about how passing profiles relate to match results.
The point is not to declare that one cluster represents the “best” kind of football. It is to build a framework for examining what teams do with the ball, then test the patterns against more matches and more information as the season develops.
What Load Gini measures in a passing network
Load centrality describes a player’s importance to the flow of a network. In a passing network, that can help identify players who act as important links in the team’s circulation. A player with a high Load value may sit on many of the routes through which the ball moves from one part of the team to another.
The Gini coefficient measures how unevenly something is distributed across a group. When applied to player Load values, it gives us a summary of how concentrated network responsibility is within a team.
A higher Load Gini means the distribution is more concentrated: some players carry a larger share of the network’s Load. A lower Load Gini means that responsibility is more evenly spread among the players included in the calculation.
This does not make one profile automatically better than the other. A concentrated structure may be intentional. A team may rely on a central midfielder, a deep playmaker or a centre-back to organise circulation. That player could be the main route through which possession moves. In another team, several players may share those responsibilities, producing a more balanced distribution.
Neither pattern tells us by itself whether the team progresses effectively, creates chances or wins matches. Load Gini describes the distribution of network responsibility. It does not explain why that distribution exists or what happens after the ball moves through those players.
A concentrated network might reflect a clear structure built around an influential organiser. It might also indicate that a team has few alternative routes through midfield. A more evenly distributed network could give a side several ways to circulate possession, but it could also reflect a lack of a clearly central connector. The number becomes more useful when we compare it with other evidence.
What final-third pass share tells us
The final-third pass share is the proportion of a team’s passes that go into the final third of the pitch. If the share rises, more of the team’s passing activity is reaching that advanced area. If it falls, a smaller proportion of its passes are entering the final third.
This metric describes where passes go. It does not measure the quality of the pass, whether it breaks a defensive line, or whether the move leads to a shot. A pass into the final third may be a valuable step in an attack, but it may also be safely recycled across the edge of a compact defence. The measure shows the frequency of reaching the zone, not the danger created there.
That distinction matters when interpreting the results. A high final-third pass share does not necessarily mean “more attacking” in every sense. It may indicate that a team reaches advanced areas frequently, but we would need additional measures to determine whether it creates high-quality chances or turns that access into goals.
The two metrics work together because they answer different questions. Load Gini asks how concentrated is the passing responsibility? Final-third pass share asks how much of the passing reaches an advanced area? One describes the network’s internal distribution; the other describes a broad spatial outcome of passing.
How KMeans created six passing profiles
KMeans grouped the 150 team observations into six clusters using Load Gini and final-third pass share. Instead of looking at each club as an isolated point, the model grouped teams with similar combinations of the two measures.
The resulting profiles are described as:
Average Load Concentration / Average Final-Third Pass Share
Lower Load Concentration / Average Final-Third Pass Share
Higher Load Concentration / Higher Final-Third Pass Share
Higher Load Concentration / Lower Final-Third Pass Share
Average Load Concentration / Lower Final-Third Pass Share
Lower Load Concentration / Higher Final-Third Pass Share
These names are relative descriptions of the clusters in this dataset. “Higher” and “lower” do not mean that a team has crossed a universal threshold, and the labels do not rank the clusters from good to bad. They make it easier to discuss the groups, but they should not be mistaken for complete tactical descriptions.
The largest group contains 46 teams with average Load concentration and average final-third pass share. Another 30 teams fall into the higher-concentration, higher-share profile. At the other end, the lower-concentration, higher-share profile contains just two teams: Strasbourg and Académico de Viseu.
The uneven size of the clusters is important. The larger groups give us more opportunities to compare teams and match outcomes. The two-team cluster is interesting because it represents a rare combination in this sample, but any conclusions about it must stay tentative. A profile represented by two clubs cannot support the same kind of broad comparison as one represented by 30 or 46.
The cluster model also does not tell us why a team falls into a particular group. It identifies similarity across the chosen variables. It does not know whether a player is a specialist passer, whether the team changed formation, whether an opponent pressed aggressively, or whether a match state altered the passing pattern. Those explanations require further analysis.
The broad shape of the team map
The overall passing-profile chart shows that teams are spread across several combinations of the two measures. Many sit around the middle of both. Others stand out through a more unusual pairing, such as high Load concentration with a high final-third share or low Load concentration with a high share.
One of the most useful points from the chart is that the two dimensions do not collapse into one simple idea of “progressive passing.” A team can have high Load concentration and a relatively high final-third share, suggesting that the measured network responsibility is concentrated while passing reaches advanced territory often. Another team can have similarly high concentration but a lower final-third share. Those sides may have comparable Load Gini values but different outcomes in the spatial measure.
The same is true at the other end. Two teams may share a lower Load Gini but differ in final-third pass share. One may distribute network responsibility broadly while reaching advanced areas at an average rate. Another may also distribute responsibility relatively broadly but have a higher share of passes enter the final third.
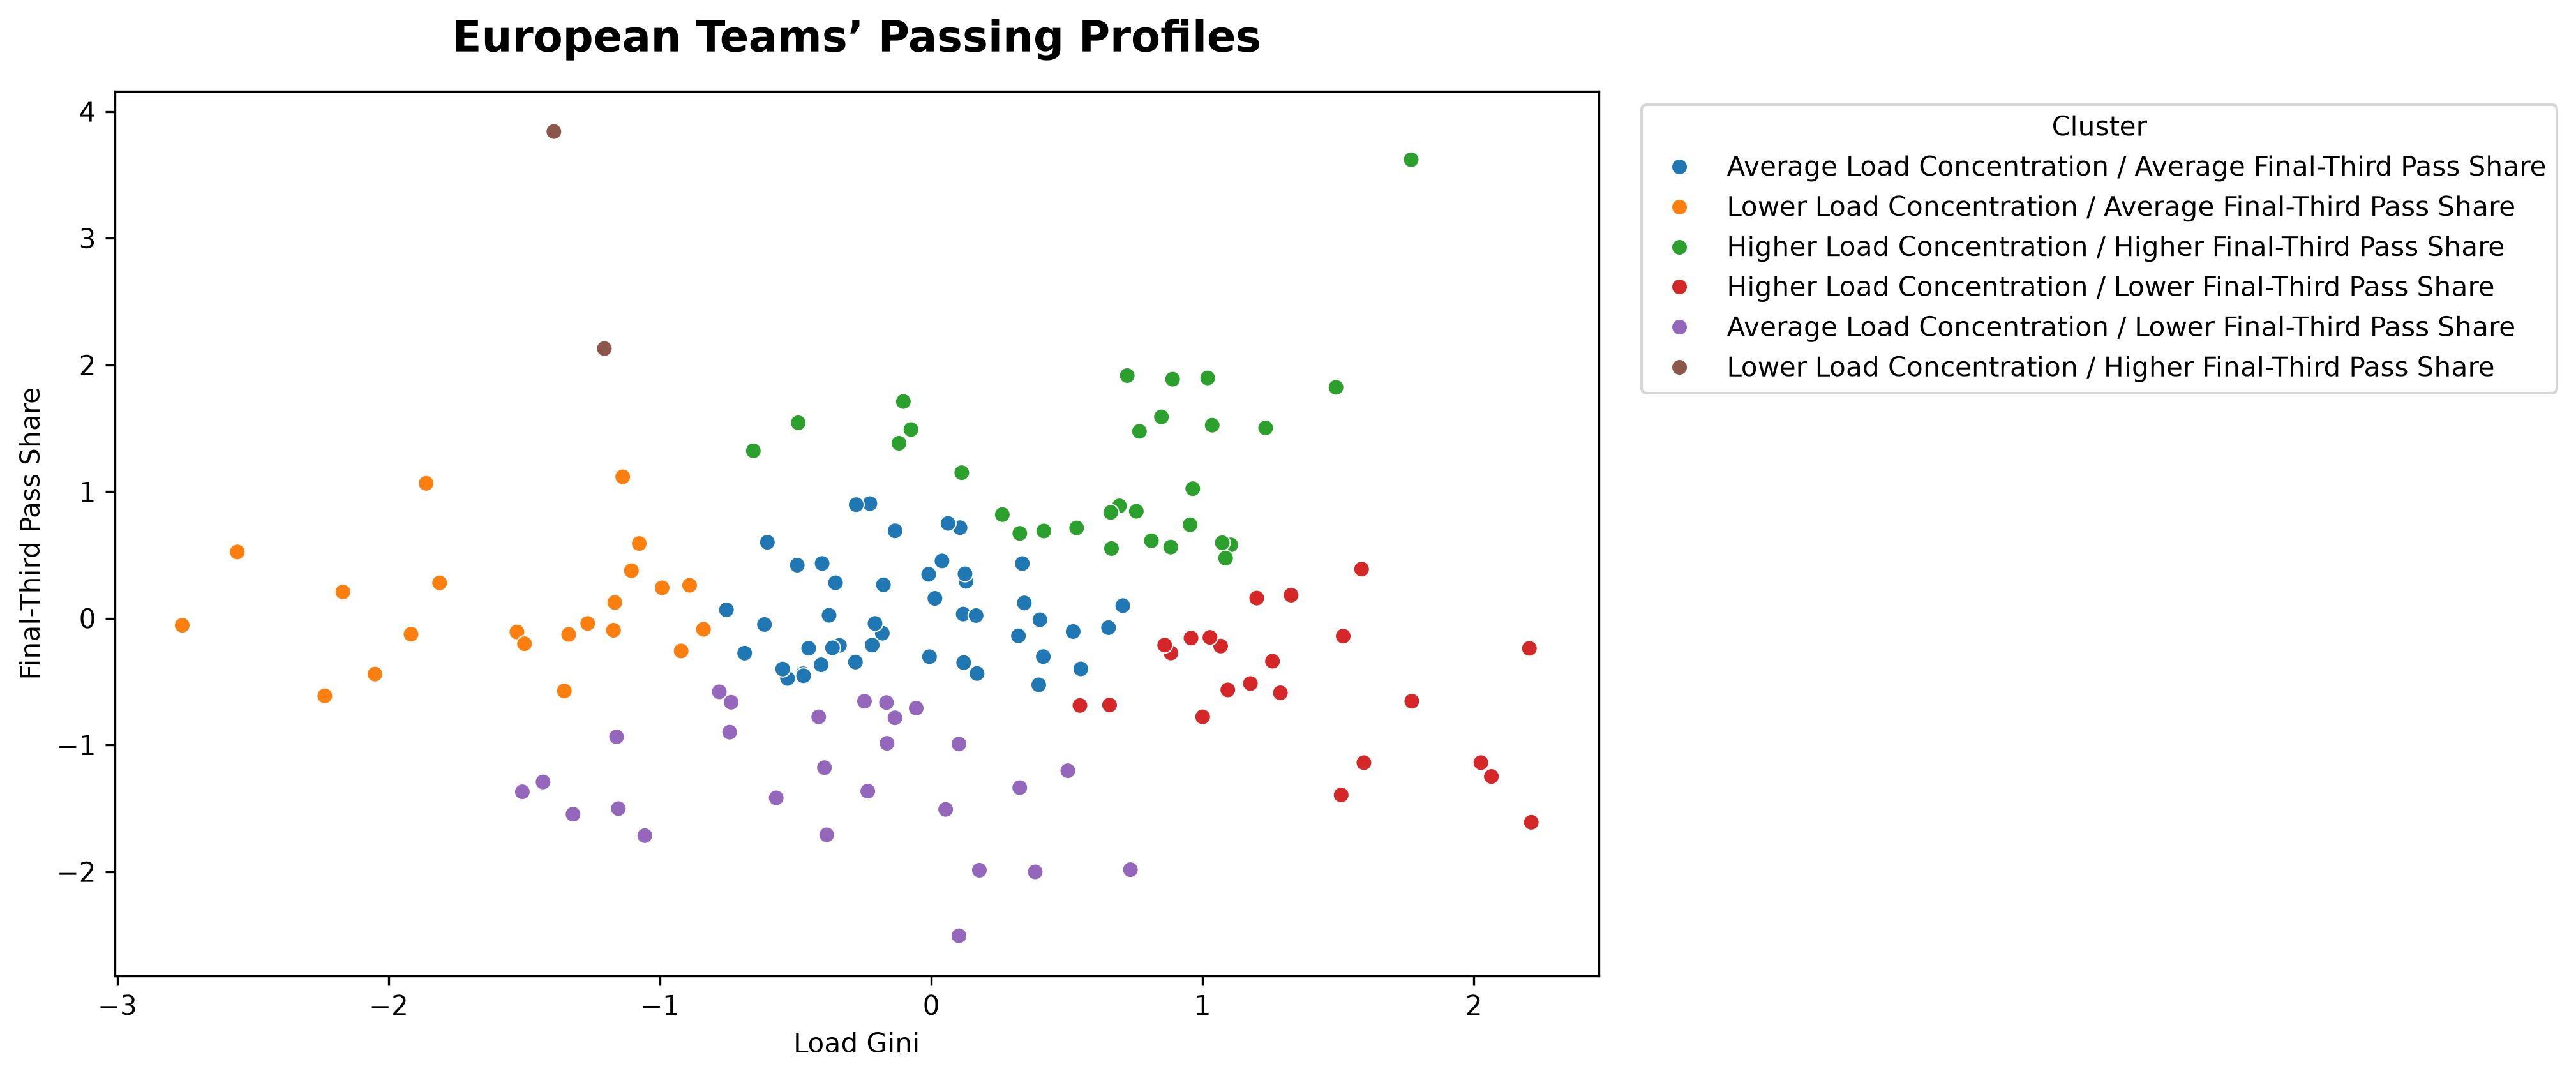
That is why the profiles are more informative as combinations than as single labels. Looking only at Load Gini would miss whether the team’s passing reaches advanced territory. Looking only at final-third pass share would miss how evenly the network responsibility is distributed.
The model gives us a starting map. The next question is what kinds of football sit behind those points. Does a team with concentrated Load build through one organiser? Does a team with a high final-third share progress through central combinations, wide switches or direct passes? Does a more evenly distributed network give the side several routes forward? The two-variable model cannot answer those questions on its own, but it helps identify teams and matchups worth examining more closely.
The Eredivisie’s early signal
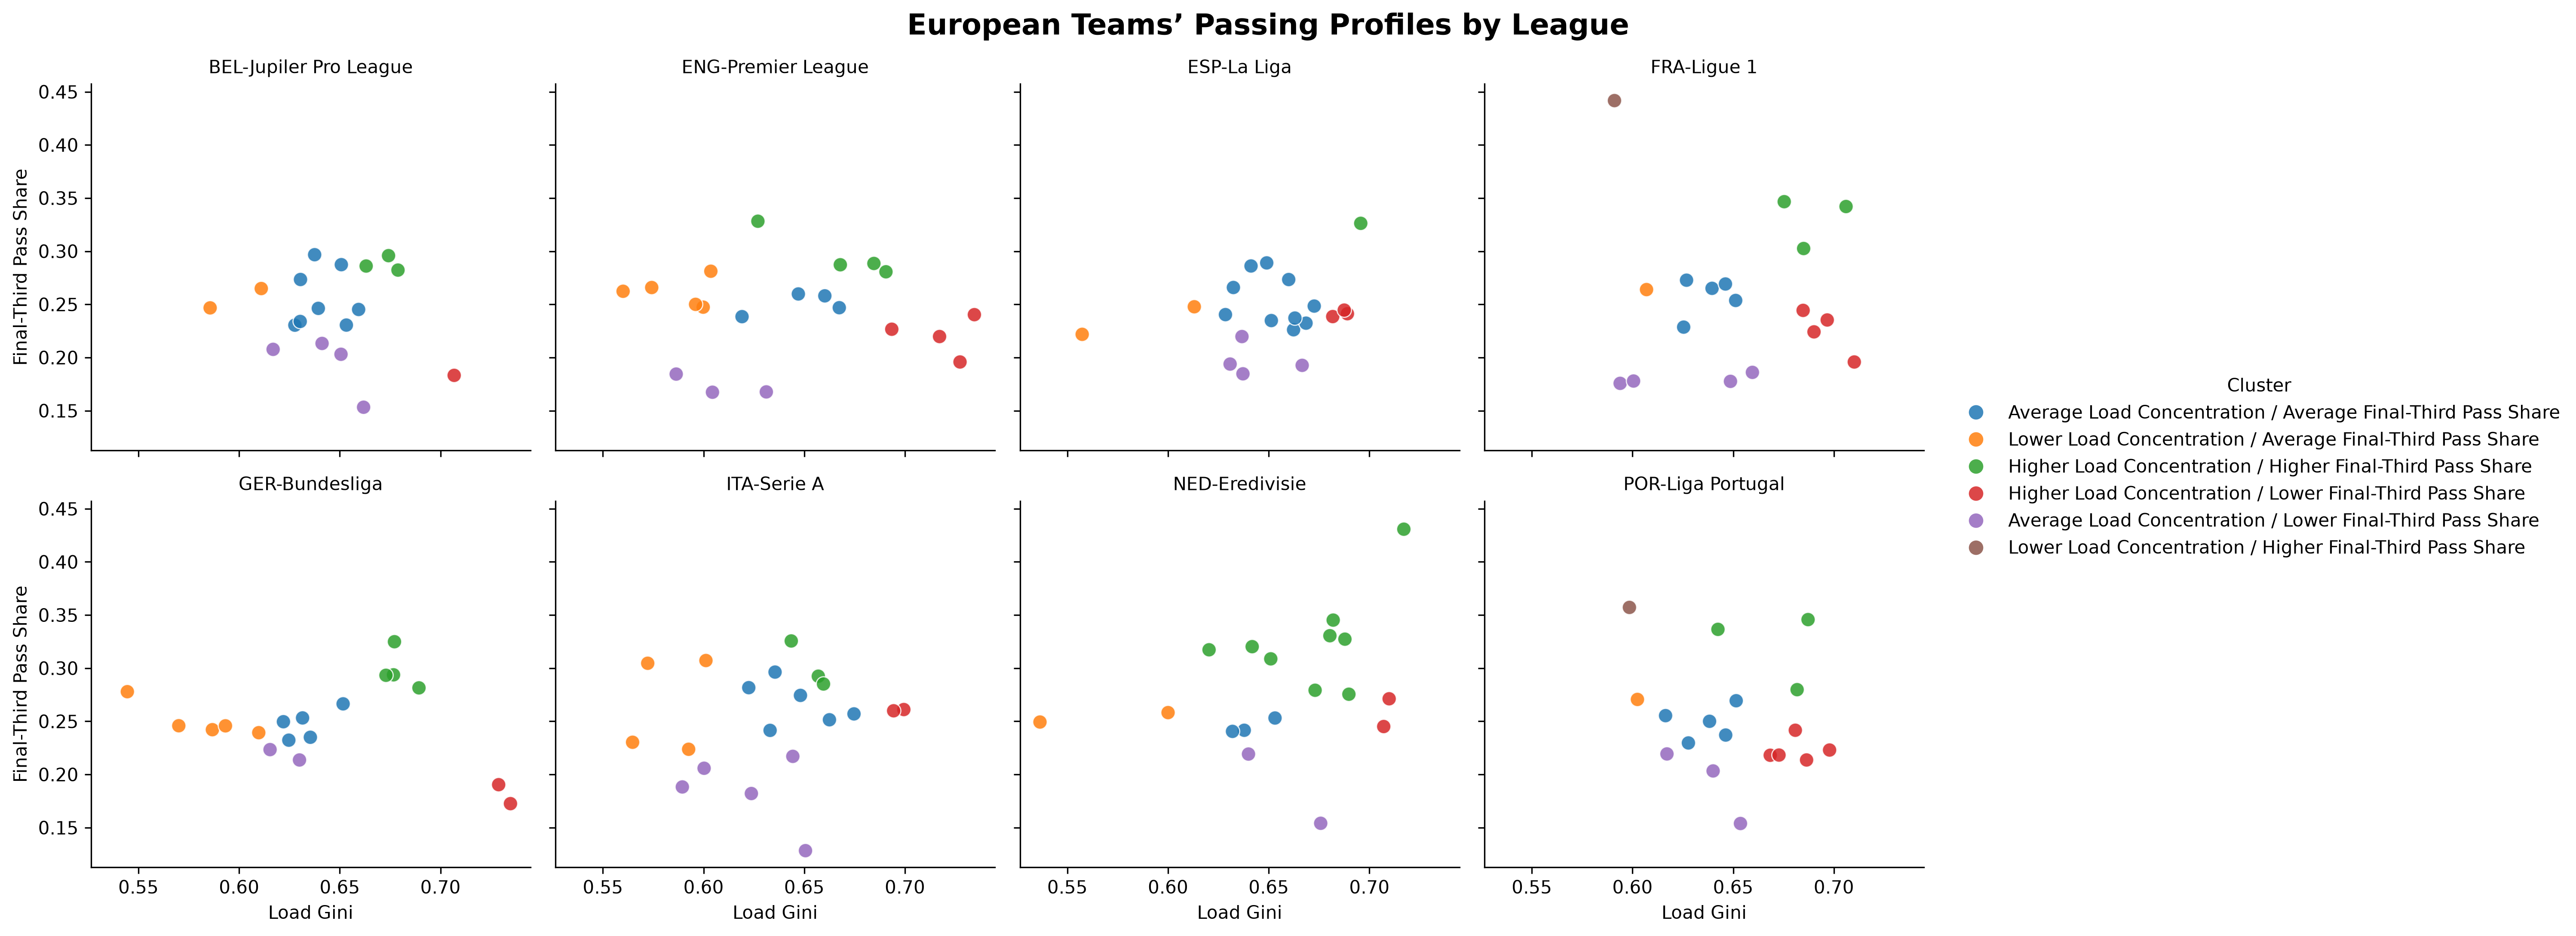
The clearest league-level difference in this sample comes from the Eredivisie. Its teams have an average final-third pass share of approximately 28.1%, the highest of the eight leagues analysed. The other league averages fall between about 24.2% and 25.6%.
That does not prove that Dutch football is inherently more advanced or more attacking. It is an early-season result from this particular sample. But it is a clear enough difference to make the Eredivisie worth following as more matches are added.
Nine of its 18 teams fall into the high-Load-concentration, high-final-third-share cluster. That group includes PSV Eindhoven, ADO Den Haag, Telstar, Excelsior, Feyenoord and FC Utrecht. The point is not that these teams necessarily play the same way. They share a similar relationship between the two indicators in the current dataset.
The Dutch chart also shows teams in other profiles. Ajax appears in the high-concentration, lower-final-third-share group, while AZ Alkmaar sits in the lower-concentration, average-share cluster. Those placements are a reminder that the league average does not describe every club. Even in the competition with the highest mean final-third share, teams occupy different areas of the profile map.
The Eredivisie result gives us a useful next question: will this higher average remain visible once each team has played more matches? If it does, we can then investigate what is behind it. Are more passes reaching the final third because teams progress through possession, because they play forward earlier, or because of the way opponents defend? Those explanations require more than the pass-share measure, but the league-level signal gives us a clear place to begin.
La Liga leans toward the middle
La Liga has a different shape. Ten of its 20 teams fall into the average-concentration, average-final-third-share cluster, making it the most common profile in the Spanish sample.
That group includes clubs such as Barcelona, Real Madrid, Atlético Madrid, Real Sociedad, Real Betis, Espanyol and Athletic Club. Their presence in the same cluster does not mean they have identical tactics or that their passing networks are interchangeable. It means that, across these two measures, their current values are close enough for KMeans to group them together.
Other La Liga teams appear in profiles with lower final-third shares or lower Load concentration. Celta Vigo, Valencia and Deportivo Alavés are among those placed in the average-concentration, lower-share group, while Getafe and Osasuna appear in the lower-concentration, average-share cluster.
This spread helps show why a cluster is not a league ranking. A competition may contain a large central group and still have meaningful variation outside it. The chart lets us see both the common pattern and the exceptions without forcing every team into one broad league-wide description.
Different pictures in England, Portugal and Germany
The Premier League is spread across several clusters rather than being dominated by one profile. Four teams fall into the high-concentration, high-share group, while four are in the high-concentration, lower-share group. Five appear in the lower-concentration, average-share cluster, and another five in the average-concentration, lower-share group.
Among the names in the high-concentration, high-share group are Arsenal, Nottingham Forest, Coventry and Sunderland. Meanwhile, Manchester City, Brighton, Fulham and Aston Villa appear in the high-concentration, lower-share cluster. This may sound counterintuitive if we treat the labels as definitive statements about a club’s attacking style. But the labels are relative to these data and these two metrics. They do not describe every aspect of a team’s football, and they do not replace a match-by-match tactical analysis.
The Primeira Liga also shows a split across multiple profiles. Five teams are placed in the high-concentration, lower-share cluster, including FC Porto, Braga, Famalicão and Santa Clara. Three are in the average-concentration, lower-share group. At the same time, Moreirense appears in the high-concentration, high-share cluster with a final-third pass share of approximately 34.6%. Rio Ave is in that group as well, at around 33.6%.
That contrast is useful because it shows how clubs in the same league can share one side of a profile and differ on another. Porto and Moreirense both fall into higher Load concentration, but their final-third pass shares place them in different groups. The two metrics capture different parts of the passing picture.
In the Bundesliga, five teams appear in the lower-concentration, average-share group, while four fall into the high-concentration, high-share profile. Bayer Leverkusen and RB Leipzig, by contrast, sit in the high-concentration, lower-share cluster in the current sample. Again, that is a description of their measured position on the chart, not a complete account of how they attack or how successful they are.
Strasbourg and the small two-team cluster
The most striking outlier in final-third pass share is Strasbourg, at approximately 44.2%. That is the highest value among the 150 team observations. KMeans groups Strasbourg with Académico de Viseu in the lower-concentration, higher-share profile.
The combination makes the cluster worth mentioning, but its size makes it difficult to generalise. With only two teams, the group is better treated as a rare profile in this dataset than as a stable category with a well-established pattern. One unusual season start or one change in the number and type of matches available could move its shape considerably.
Strasbourg’s value also shows why looking at the chart matters. A team can reach the final third with a high share of its passes while having a lower Load concentration than many teams in the sample. That is a different combination from a side that pairs high final-third share with high concentration. Both may reach advanced territory frequently, but the distribution of network responsibility is not the same.
The next step would be to investigate how Strasbourg and Académico Viseu reach those areas. The current model tells us where their metrics place them; it does not identify whether the passes are central or wide, whether they come from sustained possession, or whether they follow direct transitions.
Connecting passing profiles to match results
The matchup charts compare the performance of teams with one passing profile against opponents assigned to another. The results cover 438 matches, represented as 876 team observations because each match contributes one observation for each team.
The largest pairing in the chart is a meeting between two teams in the average-concentration, average-share profile. It contains 90 team observations, equivalent to 45 matches. Teams in that profile recorded a 45.6% win rate against opponents with the same profile and averaged 1.76 goals scored per match.
The high-concentration, lower-share profile has several matchup groups with substantial counts. Against the average-concentration, average-share profile, it has 46 team observations and a 43.5% win rate. Against opponents in the high-concentration, high-share profile, it has 29 observations, a 51.7% win rate, an average of about 1.83 goals scored per match, and a mean goal difference of approximately +0.90.
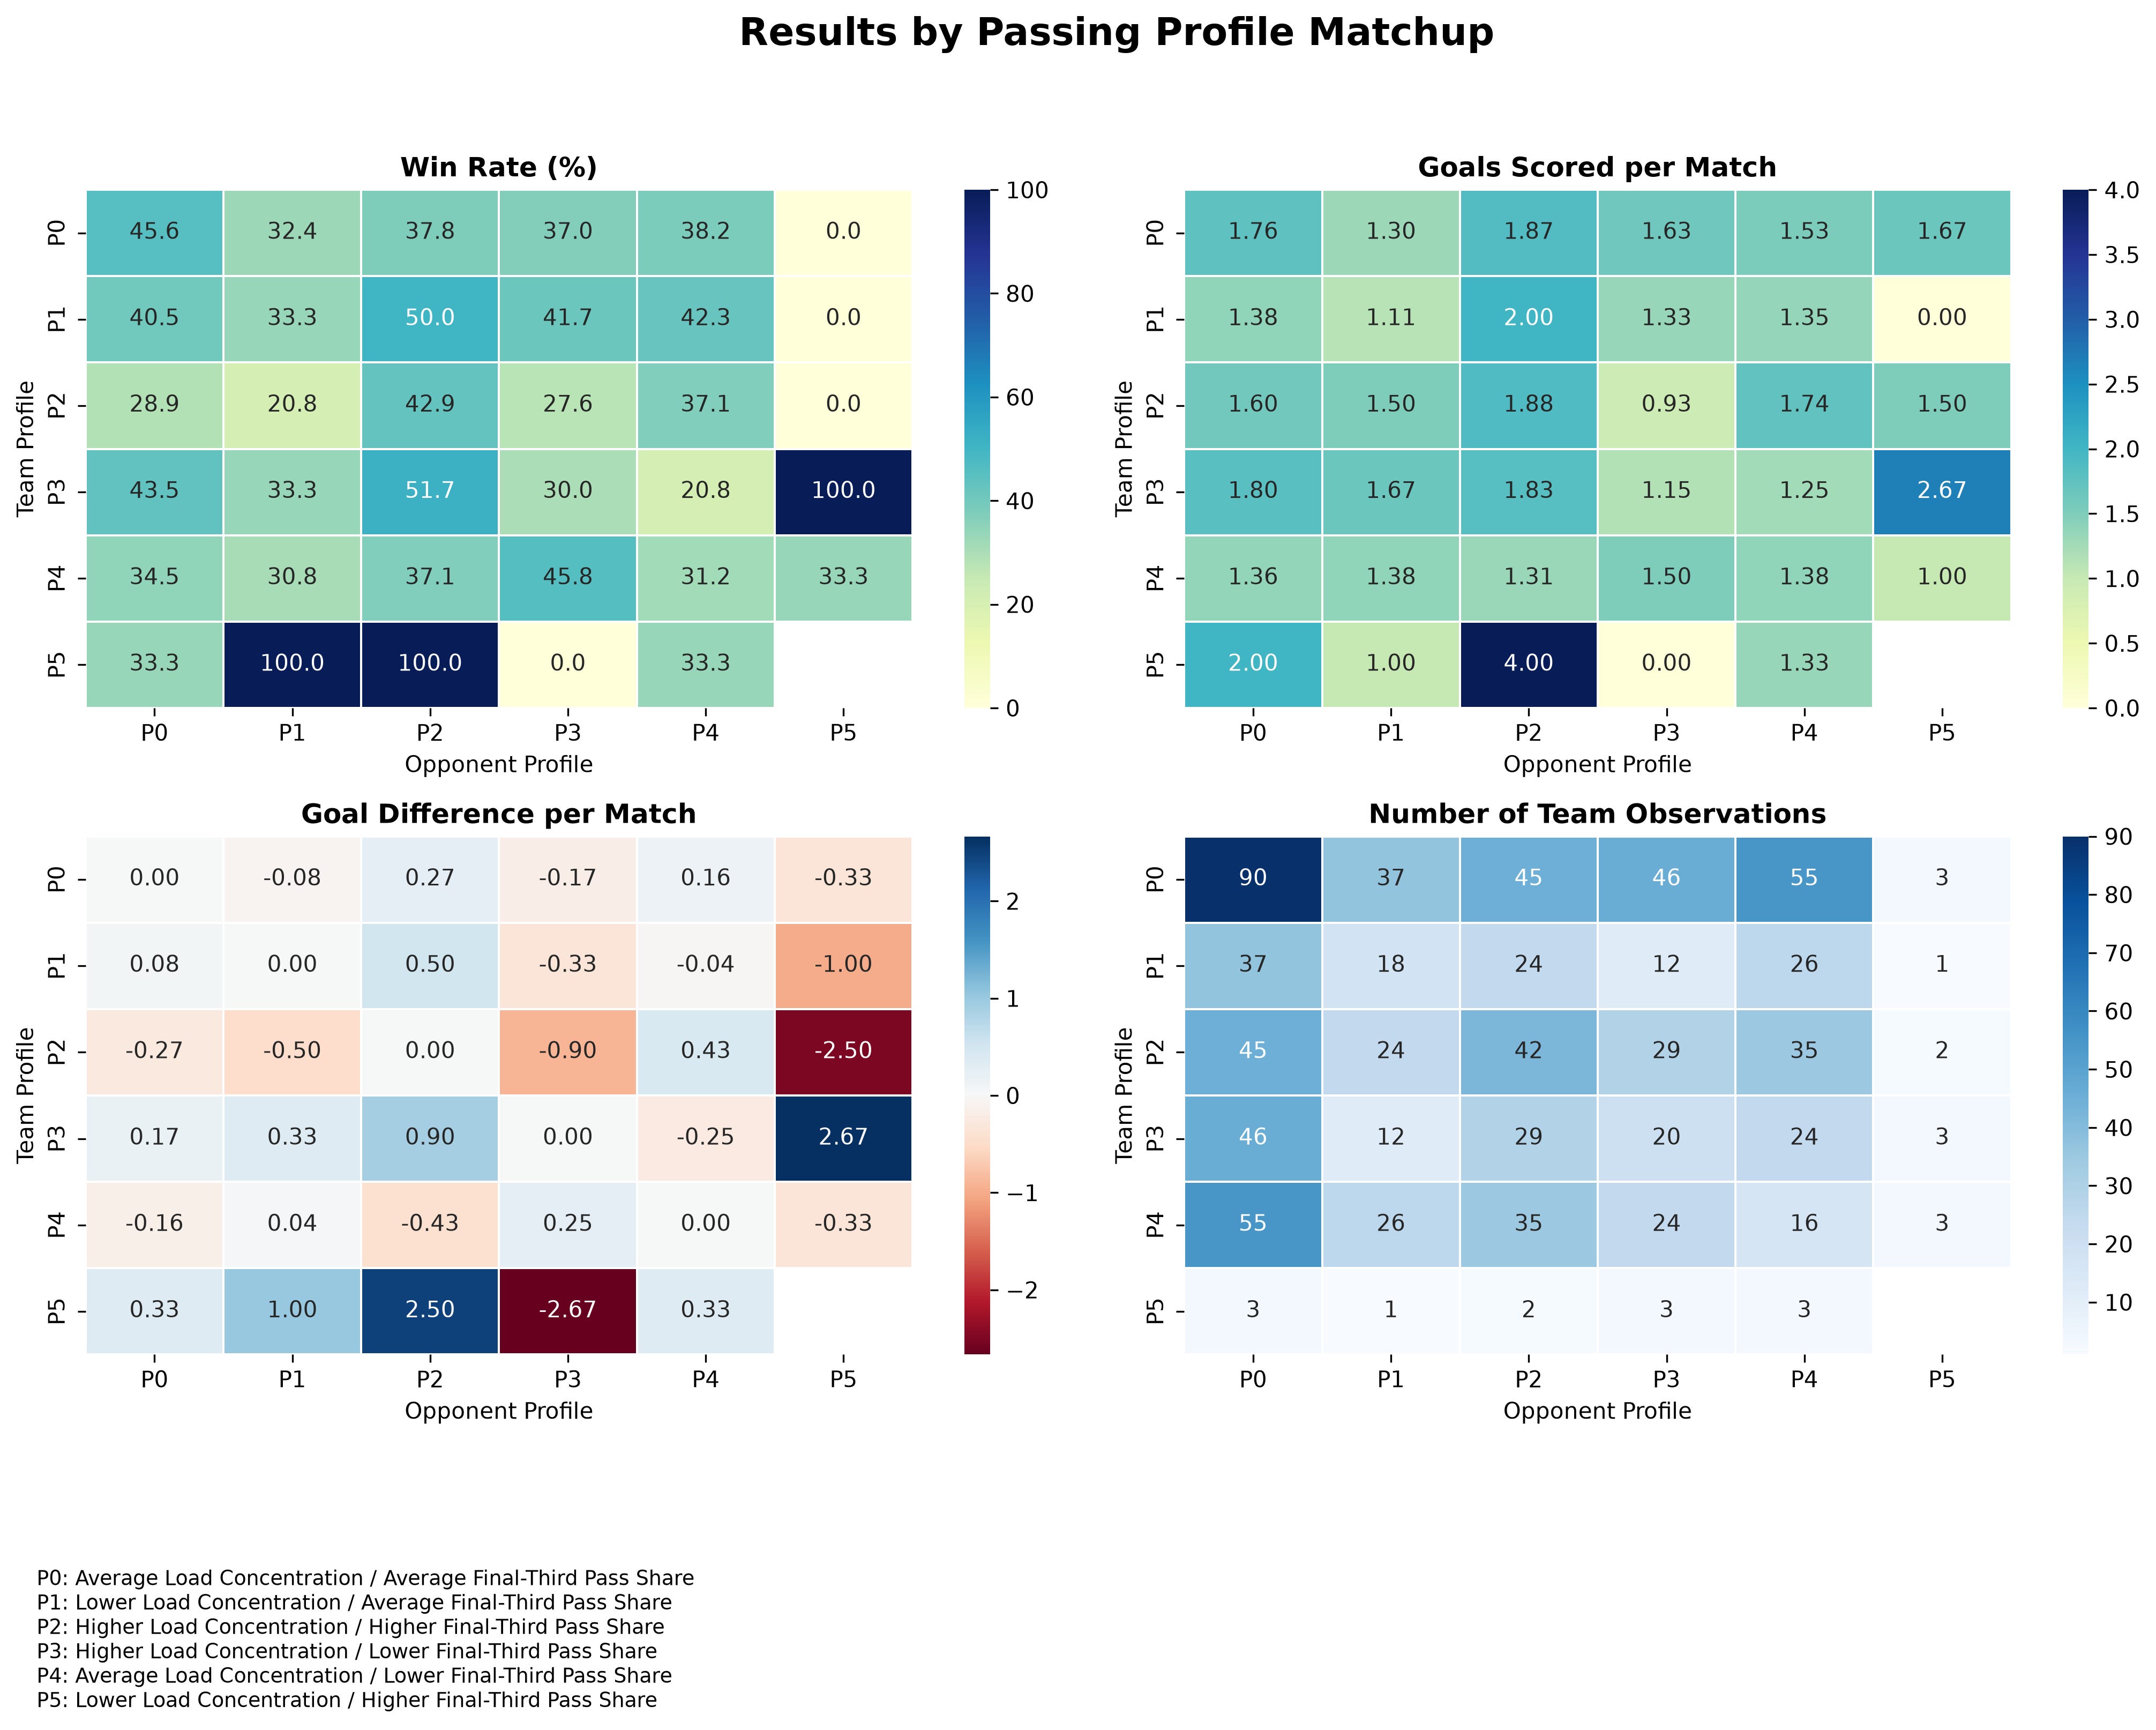
That result stands out in the chart, but it should be read as a pattern in the current sample, not as evidence that the profile causes teams to win. The sample is still modest, and the profile pairings do not control for team quality, home advantage, injuries, match state, finishing or the strength of the opposition.
The high-concentration, high-share profile also produced some notable figures. Against the average-concentration, average-share profile, it averaged 1.60 goals per match across 45 team observations. Against teams in its own profile, it averaged about 1.88 goals across 42 observations. Against the high-concentration, lower-share profile, however, it averaged less than one goal per match across 29 observations, with a negative average goal difference.
These contrasting results show why the matchup analysis can be more revealing than a simple overall profile ranking. The same profile may appear more productive against one kind of opponent and less productive against another. That possibility is worth investigating, but the present study cannot tell us whether the difference comes from a tactical interaction or from other factors in the matches.
The win-rate chart counts a draw as a match that did not produce a win for the team profile being shown. That is important when reading the percentages. A 45.6% win rate does not mean that the other 54.4% of matches were all defeats; some were draws.
What the matchup chart cannot prove
A profile-versus-profile chart can suggest that some combinations deserve a closer look. It cannot establish that one passing style caused a particular result.
A team with a high final-third pass share might score more because it advances the ball effectively. It might also score more because it has better finishers, faced weaker opponents during the sample, or converted a small number of chances unusually well. The same caution applies to goal difference. A strong figure may reflect a real matchup pattern, or it may change quickly as new results are added.
The smallest matchup groups make this especially clear. The lower-concentration, higher-share profile includes only two teams and appears in just a handful of team observations. Some cells in the chart have as few as one to three observations. A 100% win rate in such a cell is not evidence of a dependable advantage. It means that the limited number of observations all happened to be wins.
Even some of the larger cells remain early signals. A group with 29 or 45 team observations gives us more to work with than a group with two or three, but it is still not enough to make a broad causal claim. It is enough to identify an interesting relationship and ask whether it holds up across future matches.
The best use of these results is as a guide for the next round of analysis. Which specific fixtures sit behind the positive goal difference for the high-concentration, lower-share profile against the high-concentration, high-share group? Did those teams progress through the same areas? Did the losing sides attempt more passes into the final third but create fewer chances? Did the profile pairing behave differently depending on which team played at home?
Those questions turn an initial chart into a research path. They also help prevent the cluster labels from doing too much explanatory work. A label can organise the teams. It cannot replace looking at what happened in the matches.
Why the early-season sample matters
The analysis includes 150 team profiles across eight leagues, but it was created near the beginning of the season. Many teams have played only a small number of matches. A team’s early values can be influenced by an unusual fixture list, a difficult opponent, a red card, an early lead that changes its approach, or a short run of especially effective or ineffective passing.
That makes the current cluster assignment a snapshot. It may remain stable as more matches arrive, or it may change. A team that begins with a high final-third pass share could settle closer to the average once its sample grows. A side that currently appears in a lower-share profile could move upward after a run of matches against opponents that allow more possession in advanced areas.
The league comparisons need the same caution. The Eredivisie’s higher average is a meaningful feature of this sample, but it is not yet a fixed statement about the whole season or a permanent description of Dutch football. The difference should be monitored as the dataset expands.
There is also a practical distinction between team observations and match observations. The 150 team profiles describe the clubs on the profile chart. The matchup figure uses 438 matches and represents each match from both teams’ perspectives, producing 876 team observations. That is why the largest matchup cell can contain 90 observations even though the underlying number of fixtures is 45.
As the season progresses, this structure will let us examine whether the initial patterns persist. We can see whether teams remain in their clusters, whether certain profile pairs recur, and whether the early differences in goals and results become clearer or disappear.
What I want to test next
The current analysis is deliberately narrow: two passing indicators, six KMeans profiles and the results from the available matches. That makes the first comparison readable, but it also leaves several important parts of the game outside the model.
A natural next step is to add measures that describe what happens after the ball reaches the final third. Do teams in the high-share profiles take more shots? Do they create better chances? Are they progressing through central combinations, through the wide areas, or with longer passes? Does a concentrated network rely on one player to enter the final third, or does that player mainly circulate the ball before someone else advances it?
Another step is to follow profiles over time. Rather than assigning one label to a team and treating it as permanent, we can ask how often a team’s match-by-match behaviour resembles each cluster. That could help separate a stable passing tendency from a profile that changes with the opponent or the context of a particular game.
The matchup results also invite a closer look at specific profile pairs. The positive goal difference for high-concentration, lower-share teams against high-concentration, higher-share opponents is one example. The next question is not whether the chart proves a tactical advantage; it does not. The more useful question is whether video and additional match data reveal a recurring explanation in those fixtures.
That is where the team labels become practical. They reduce a large collection of fixtures into groups that can be compared, helping us decide which matches to inspect and what patterns to look for. The numbers can point us toward a question. The deeper analysis still has to establish what happened on the pitch.
A first map to build on
KMeans has grouped 150 teams into six passing profiles based on Load Gini and final-third pass share. The early results show an Eredivisie sample with a higher average final-third pass share than the other leagues, a strong concentration of La Liga teams in the average-average profile, and considerable variation across the Premier League, Primeira Liga and Bundesliga.
The matchups add another layer. Some profile pairings are associated with higher goal totals or stronger goal differences, while others show less productive outcomes in this sample. Those are signals to follow, not proof that passing profiles determine results. The early-season dataset is small, the matchup counts are uneven, and several striking percentages come from very few observations.
That is exactly why the next stage matters. As the sample grows, we can see whether these clusters remain stable, whether the league differences persist and whether the matchup patterns hold up. For now, the analysis gives us a clear framework for asking a more precise question about European football: how does the distribution of passing responsibility relate to a team’s ability to reach the final third, and what happens when different passing profiles meet?
Download the Spreadsheets

Paid subscribers can download the spreadsheets behind this analysis below. The first file contains each team’s league, Load Gini, final-third pass share and KMeans profile. The second contains the analysed matches, including the teams, their assigned profiles, the score and the result.