From Raw Data to Insight: Visualizing Football Shots from FotMob with Python (Final Part)
You’ve scraped the data. Now let’s see what it’s really saying


If you made it this far, you’re officially at the final chapter of this web scraping series. And before we write a single new line of code, I want to say Thank You.
Thank you to everyone who trusted my work enough to become a premium subscriber. Your support is what makes it possible to go deeper, build things properly, and publish content that goes beyond surface-level tutorials.
And if you’re reading this and you’re not a premium subscriber yet, this is the perfect moment to become one. This article closes the series with something extremely concrete: we finally turn scraped football data into a real, interpretable visualization.

👉 Upgrade to premium and unlock the full series.
This is also the article where everything clicks.
All the scraping, all the data cleaning, all the small technical decisions finally pay off visually.
So I strongly encourage you to read this post until the end. Not just for the final chart, but because understanding why we structure data this way will make you a much better analyst, scraper, and Python user.
And as always, you can already explore real football insights in my free web app here:
👉 https://footballhacking.streamlit.app/
A Quick Recap: Where We Left Off
Before we move forward, let’s briefly reconnect with the previous step of this journey.
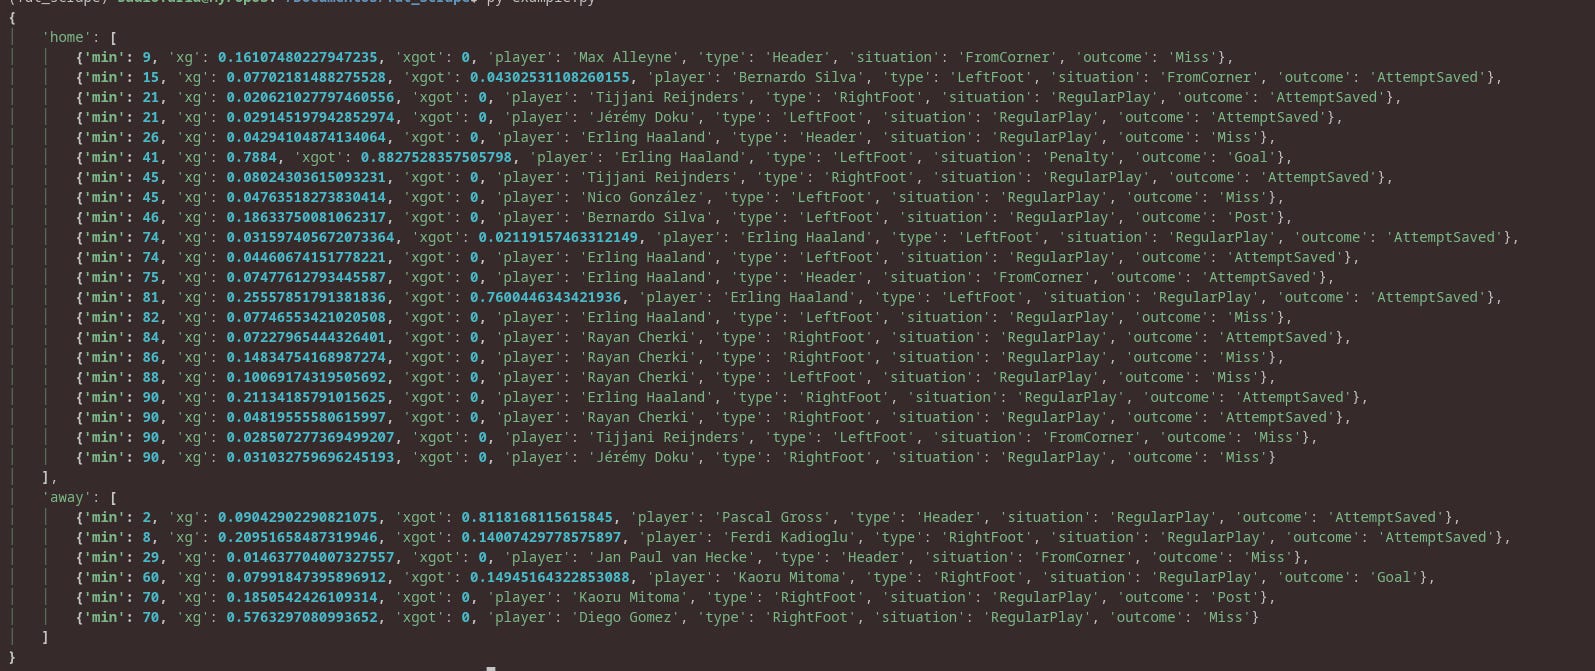
In the last article, we focused on extracting shot data from FotMob, transforming raw API responses into a structured Python dictionary containing information such as:
Minute of the shot
Expected Goals (xG)
Expected Goals on Target (xGoT)
Shot outcome
Team identifier
If you haven’t read that post yet, I highly recommend doing so first, because this article builds directly on top of it.
You can find it here:
👉 https://www.footballhacking.com/p/web-scraping-football-data-with-python-2e3?r=30n7hp
Now, instead of stopping at raw data, we’ll take the most important step in any data project:
turning numbers into something we can actually interpret.