
How to Build a Football Pass Network in Python (Step by Step)
Stop Guessing, Start Mapping: Visualizing Ball Circulation with Pass Networks


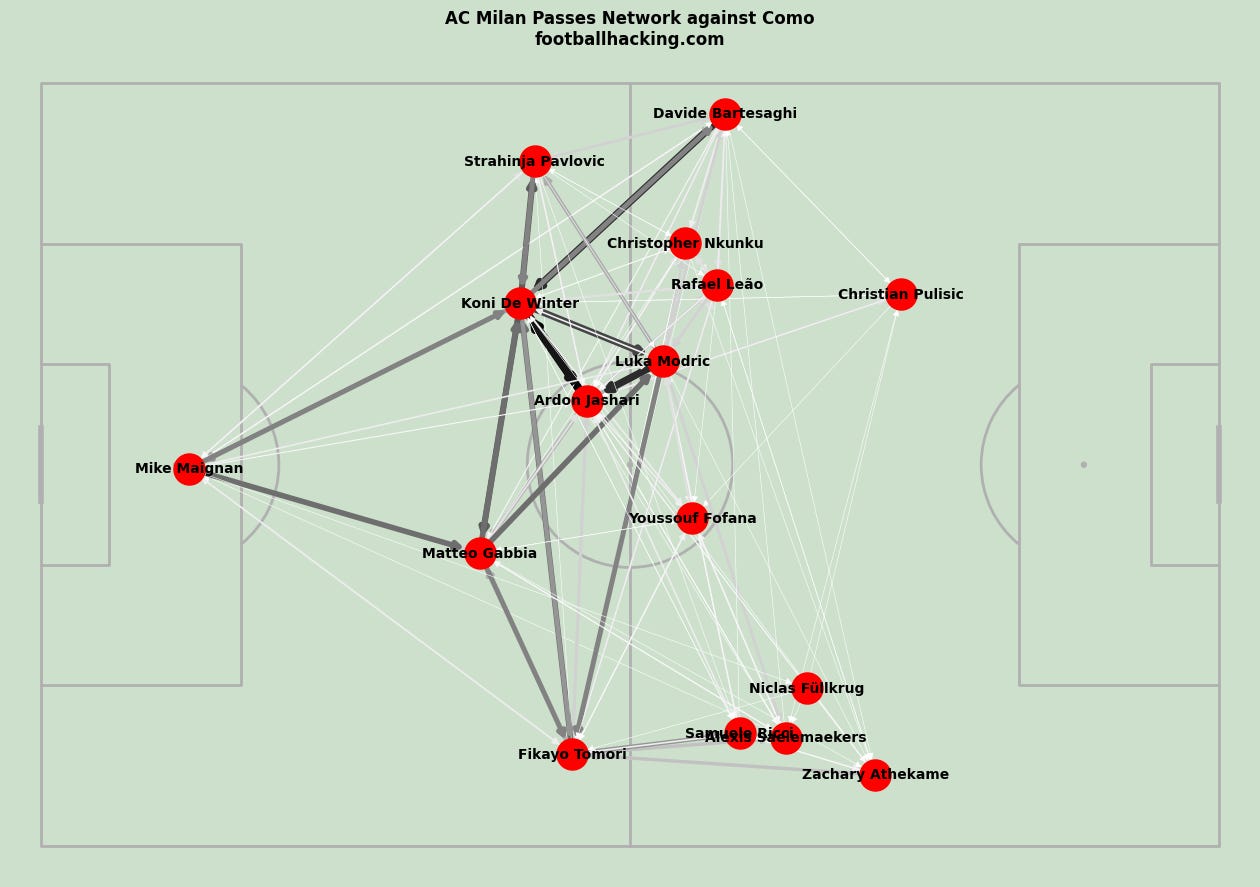
If you’ve ever wanted to visualize how a team actually moves the ball on the pitch, pass networks are one of the most powerful (and elegant) tools you can use. They turn raw event data into a tactical map: who connects with whom, where players operate, and which relationships really drive the game.
Before we jump into the code, an important note: the data used to build this kind of pass network can be downloaded directly from the Football Hacking app, exactly as shown in the image above. Instead of being locked into static charts, you can grab the raw CSV files and create your own visualizations, tweak them, and run your own analysis in Python.
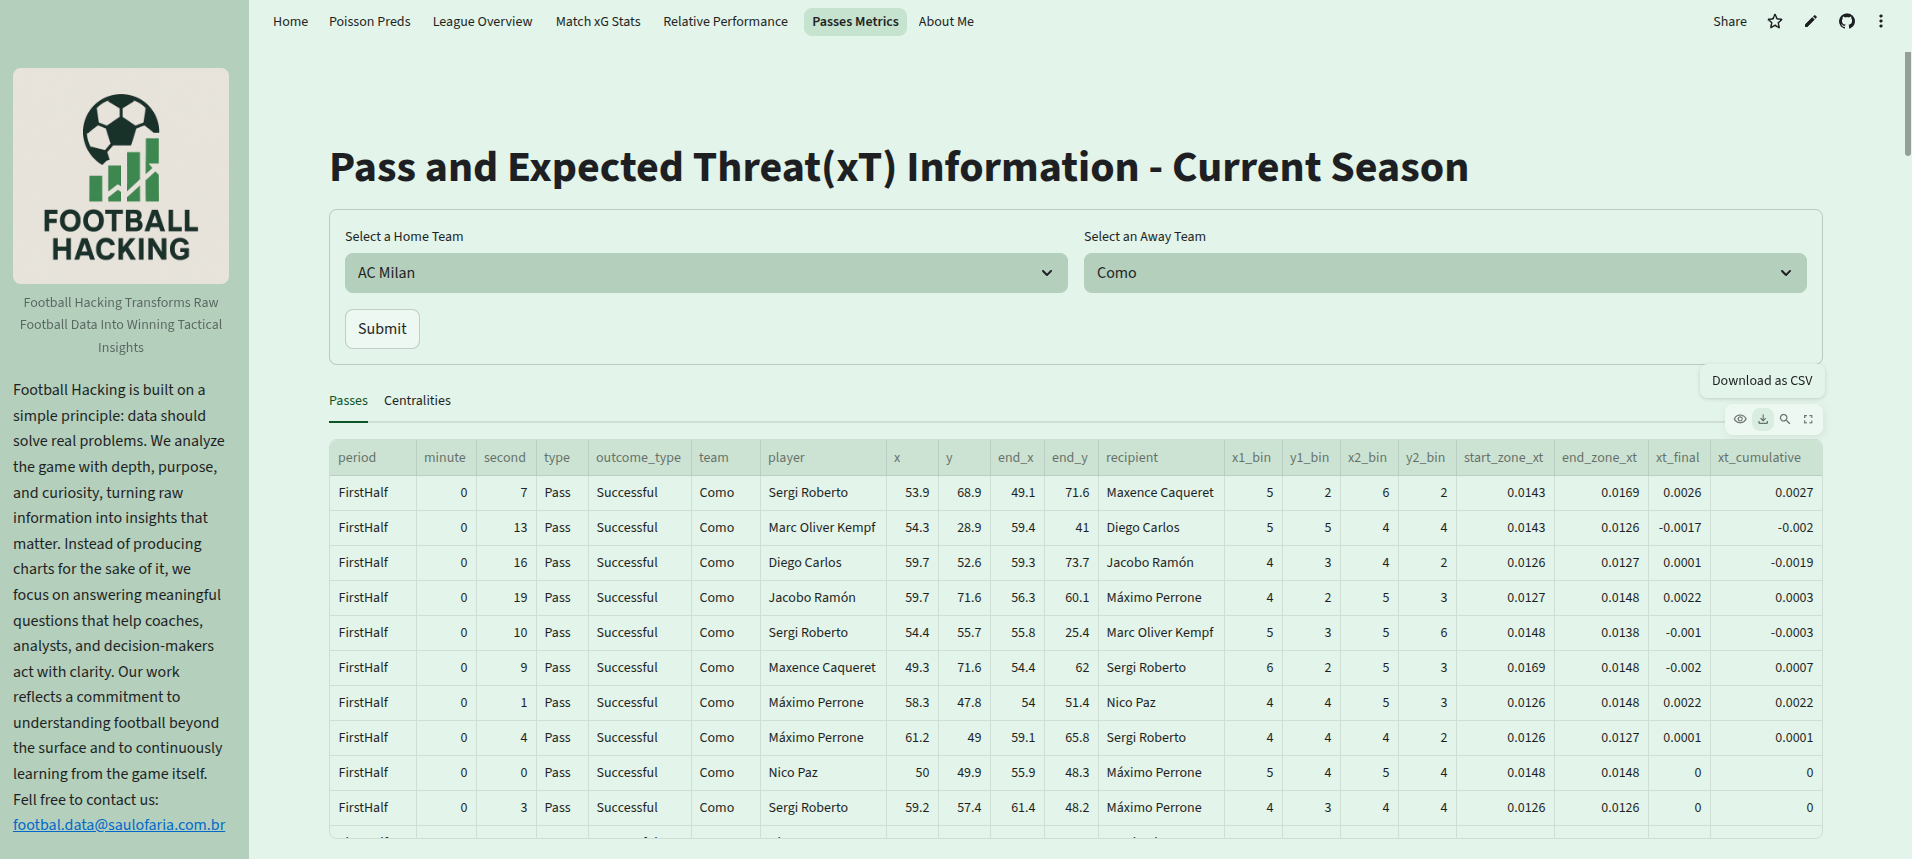
That independence is the whole point here. Once you control the data, you control the questions you can ask.
In this article, I’ll walk you through a complete Python script that:
Loads pass data from a CSV file
Filters it to a single team (AC Milan, in this case)
Computes average player positions
Counts passing interactions between players
Builds a directed pass network using NetworkX
Plots everything on a football pitch using
mplsoccerandmatplotlib
By the end, you’ll not only understand what each line does, but you’ll also know how to adapt this to any team, any match, any league — especially using data downloaded from the Football Hacking app.
Why Pass Networks Matter in Football Analysis
A pass network is more than a pretty graphic. It’s a compact way to answer questions like:
Who are the main hubs in possession?
Which players connect most often?
Is the team building through the center or the flanks?
Are there isolated players in the structure?
Who actually controls the tempo?
Instead of looking at hundreds or thousands of individual passes, you get a structural overview of how the team plays.
And the best part? With Python and open libraries, you can build this yourself in a few dozen lines of code.
The Libraries We Use
Let’s start with the imports:
import pandas as pd
from mplsoccer import Pitch
import matplotlib.pyplot as plt
import networkx as nx
Each library has a clear role:
pandas: for loading and manipulating the CSV data.
mplsoccer: for drawing a proper football pitch with correct coordinates.
matplotlib: for general plotting and figure styling.
networkx: for creating and handling the pass network as a graph (nodes and edges).
This combination is extremely common in football analytics workflows: pandas for data, NetworkX for structure, mplsoccer + matplotlib for visualization.
Loading the Data
df = pd.read_csv('passes_mil_com.csv')
df = df[df['team'] == 'AC Milan']
Here, we read a CSV file containing pass events. This is exactly the kind of file you can download from the Football Hacking app.
Then we filter the dataset to keep only AC Milan’s passes. This is crucial: a pass network usually represents one team’s internal structure, not both teams mixed together.
At this point, df contains only passes made by AC Milan players in this match.
