
Manchester City vs Arsenal: What the Pass Network Prediction Got Right (and Wrong) — A Data-Driven Tactical Review
How pre-match pass network and xT analysis anticipated the structural battle — and how it actually played out on the pitch


This analysis is grounded in a data-driven framework built on pass network structures and Expected Threat (xT). Rather than relying on surface-level metrics, it evaluates how each team organizes possession, how value flows through their passing network, and how attacking sequences evolve under pressure. By combining network centrality, progression patterns and xT dynamics, the objective is to translate what is typically seen qualitatively on the pitch into measurable, repeatable insights — revealing not just where teams play, but how and why their structure generates or destroys value
Before kickoff, the matchup between Manchester City and Arsenal was framed as a structural collision: two teams that seek control through organization rather than chaos, but with very different ways of preserving value once resistance appears.
The pre-match model, built on pass network structure and xT (Expected Threat), raised a very specific question:
Which team would preserve attacking value after first resistance?
Ninety minutes later, the answer is clear.
Manchester City did. Arsenal did not.
This is a full post-match validation of that pre-game structural diagnosis — not just what happened, but why it happened, where the model was accurate, where it needs refinement, and what this tells us about both teams going forward.
Why this analysis matters (and why it’s different)
This is not based on highlights or subjective interpretation.
This analysis is built on:
Pass network structure (graph theory applied to team behavior)
xT (Expected Threat) to measure progression value
Structural repetition (what happens consistently, not occasionally)
That matters because this match was full of false signals:
High-frequency actions with low value
Territorial presence without attacking continuity
Defensive pressure that disrupts without damaging
If you only watched the match, you saw a tight 2–1.
If you read the structure, you saw a systematically tilted game.
1. The Core Prediction: A Match Decided After First Resistance
What the matchup predicted
The pre-match analysis identified a central asymmetry:
Manchester City: strong resistance-response profile → able to escape pressure and continue attacking
Arsenal: weaker resistance-response → more likely to lose continuity under pressure
It also identified the key battleground:
City’s left-corridor platform vs Arsenal’s ability to stop the second-wave release (especially to the far half-space).
What actually happened
The match confirmed this almost perfectly.
City consistently:
Absorbed pressure
Escaped with structure intact
Re-entered attacking phases with forward orientation
Arsenal consistently:
Reached promising zones
Faced resistance
Lost value and reset
This was not random.
It was structural.
And it defined the game.
2. Structural Collision: Prediction vs Reality
Pre-match expectation
City would build through central circulation → left corridor stabilization
Arsenal would seek central corridor control and compression
The game would be decided by what happens in congested zones
What actually happened
City imposed the broader, more functional structure.
Even though:
Arsenal had a slightly higher structure index (shape quality)
City dominated:
Flow
Efficiency
Conversion of structure into attack
This is a critical distinction.
Arsenal had structure.
City had functional structure.
The real asymmetry
Arsenal could form shape
City could operate inside shape under pressure
That’s why the match tilted.
3. Manchester City: The Predicted Left-Corridor Platform… Confirmed
What the model said
City would:
Use the left corridor as a stable final-third entry
Not as an endpoint, but as a platform
Generate real threat through:
Cross-structure switches
Second and third waves
What happened on the pitch
Exactly that.
City’s dominant pattern:
Central circulation → left corridor → resistance → continuation → re-entry
The key detail:
The left corridor was not just used frequently.
It was:
Repeatable
Stable under pressure
Connected to future actions
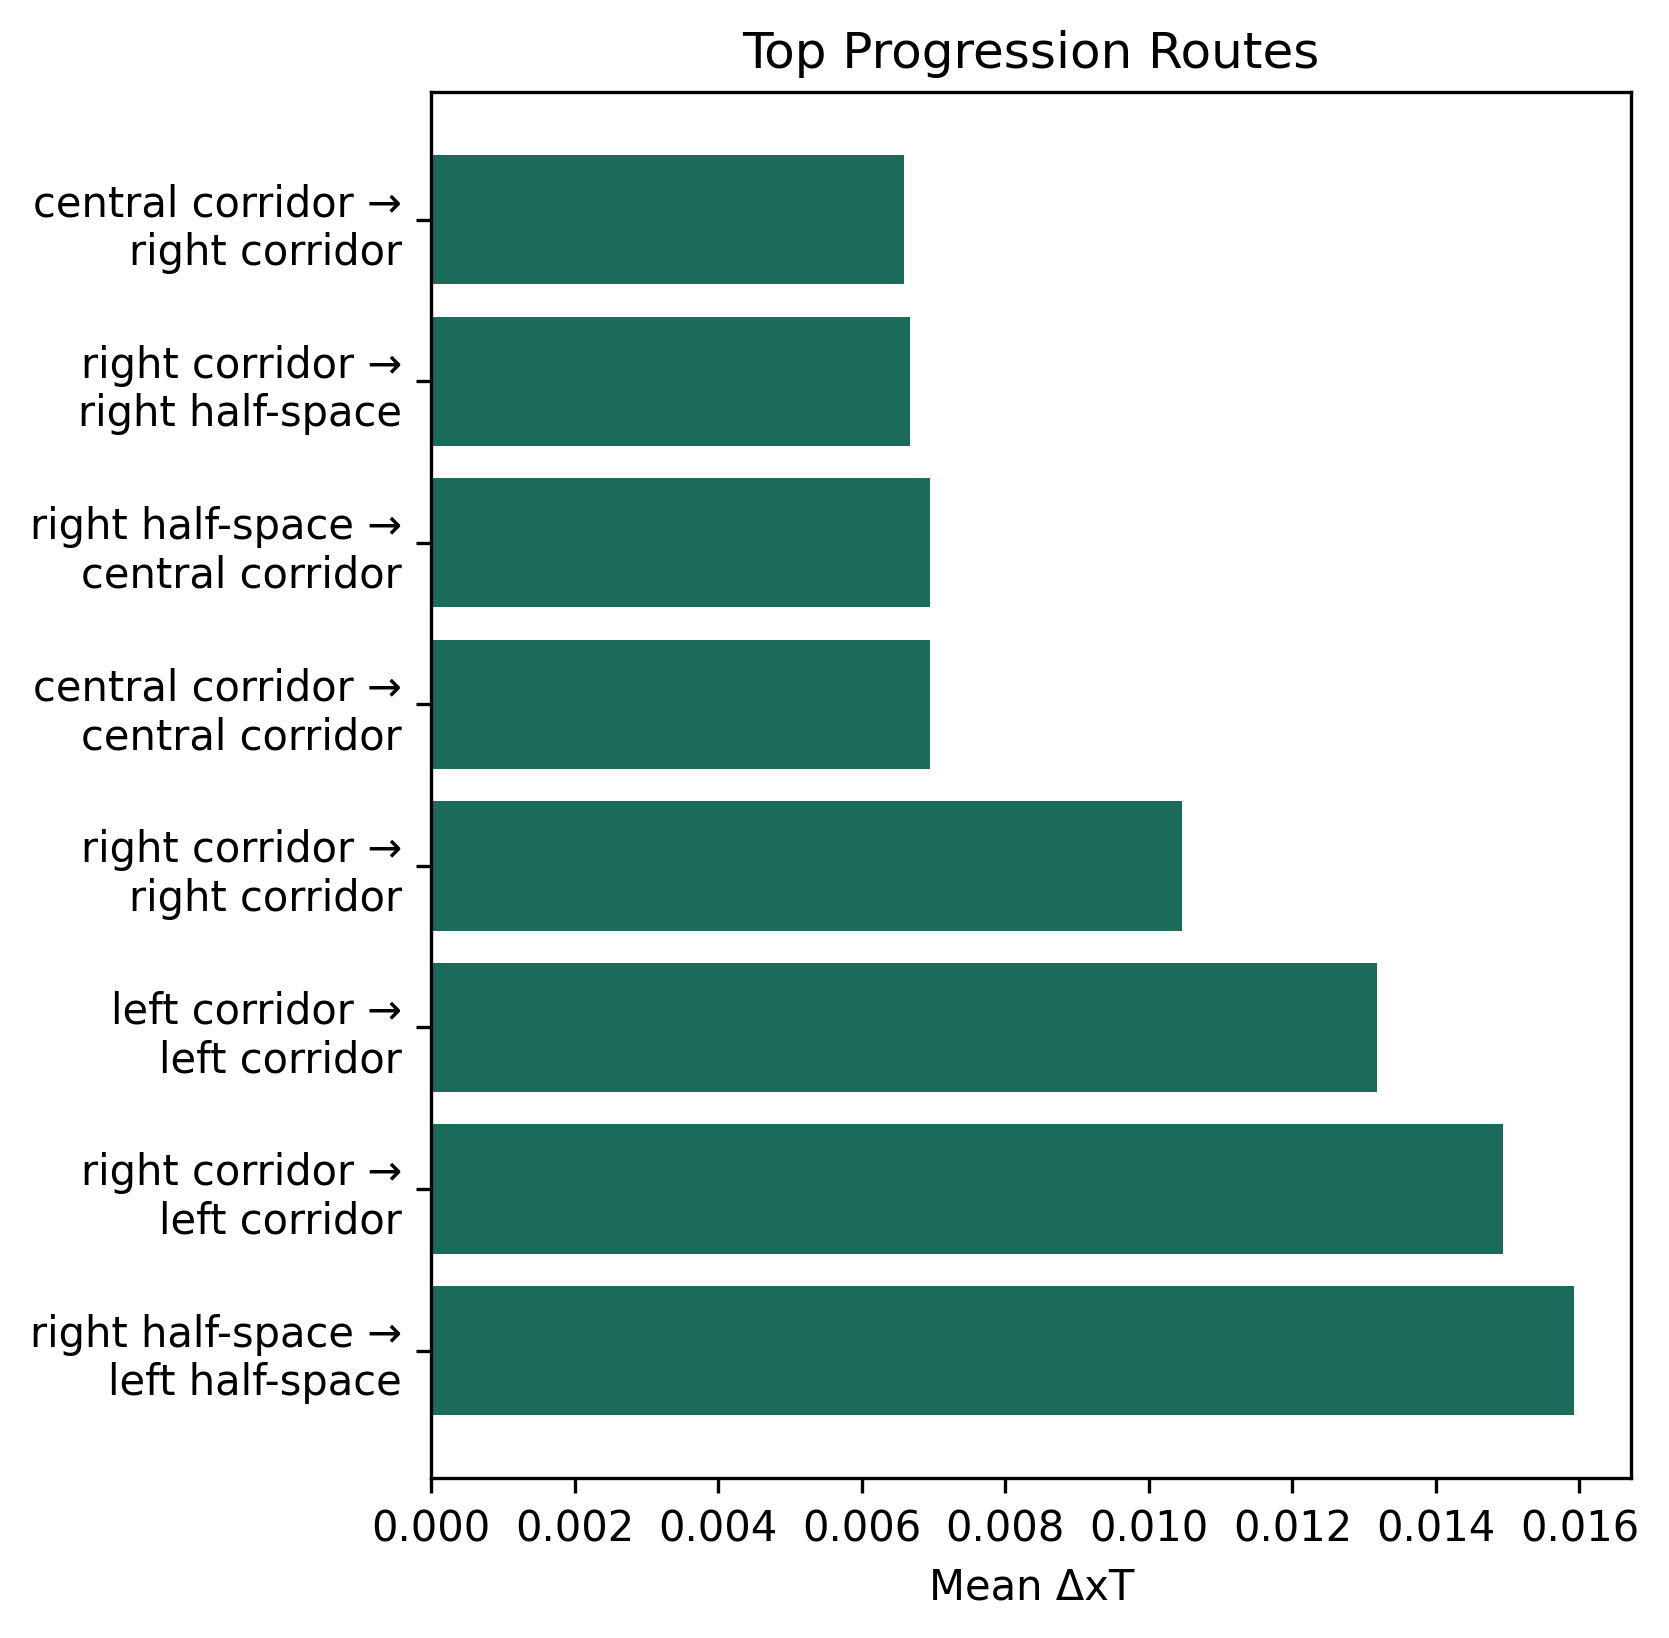
Where the model was 100% right
The matchup warned:
High-frequency left entries are not the real threat. The real threat is what comes next.
In the match:
Left-side entries created territorial stability
Real danger came when City:
Reconnected centrally
Or switched into the opposite half-space
Additional confirmation: multi-lane continuity
City also showed:
Right corridor continuity
Strong right half-space resistance escape
Meaning:
The system was not one-dimensional
It was structurally elastic
This is exactly what the model suggested.
4. Arsenal: Central Access Without Continuity (Exactly as Predicted)
What the model said
Arsenal would:
Progress centrally
Rely on half-space → central connections
Struggle when resistance appears
What actually happened
Again — confirmed.
Arsenal had:
Central corridor access
Interior progression routes
But they lacked:
Continuation after pressure
The key structural failure
The model warned:
Arsenal can reach their zones, but they are less reliable at preserving attacking continuity.
In the match:
Central entries occurred
But were followed by:
Backward escape
Lateral escape
Value loss
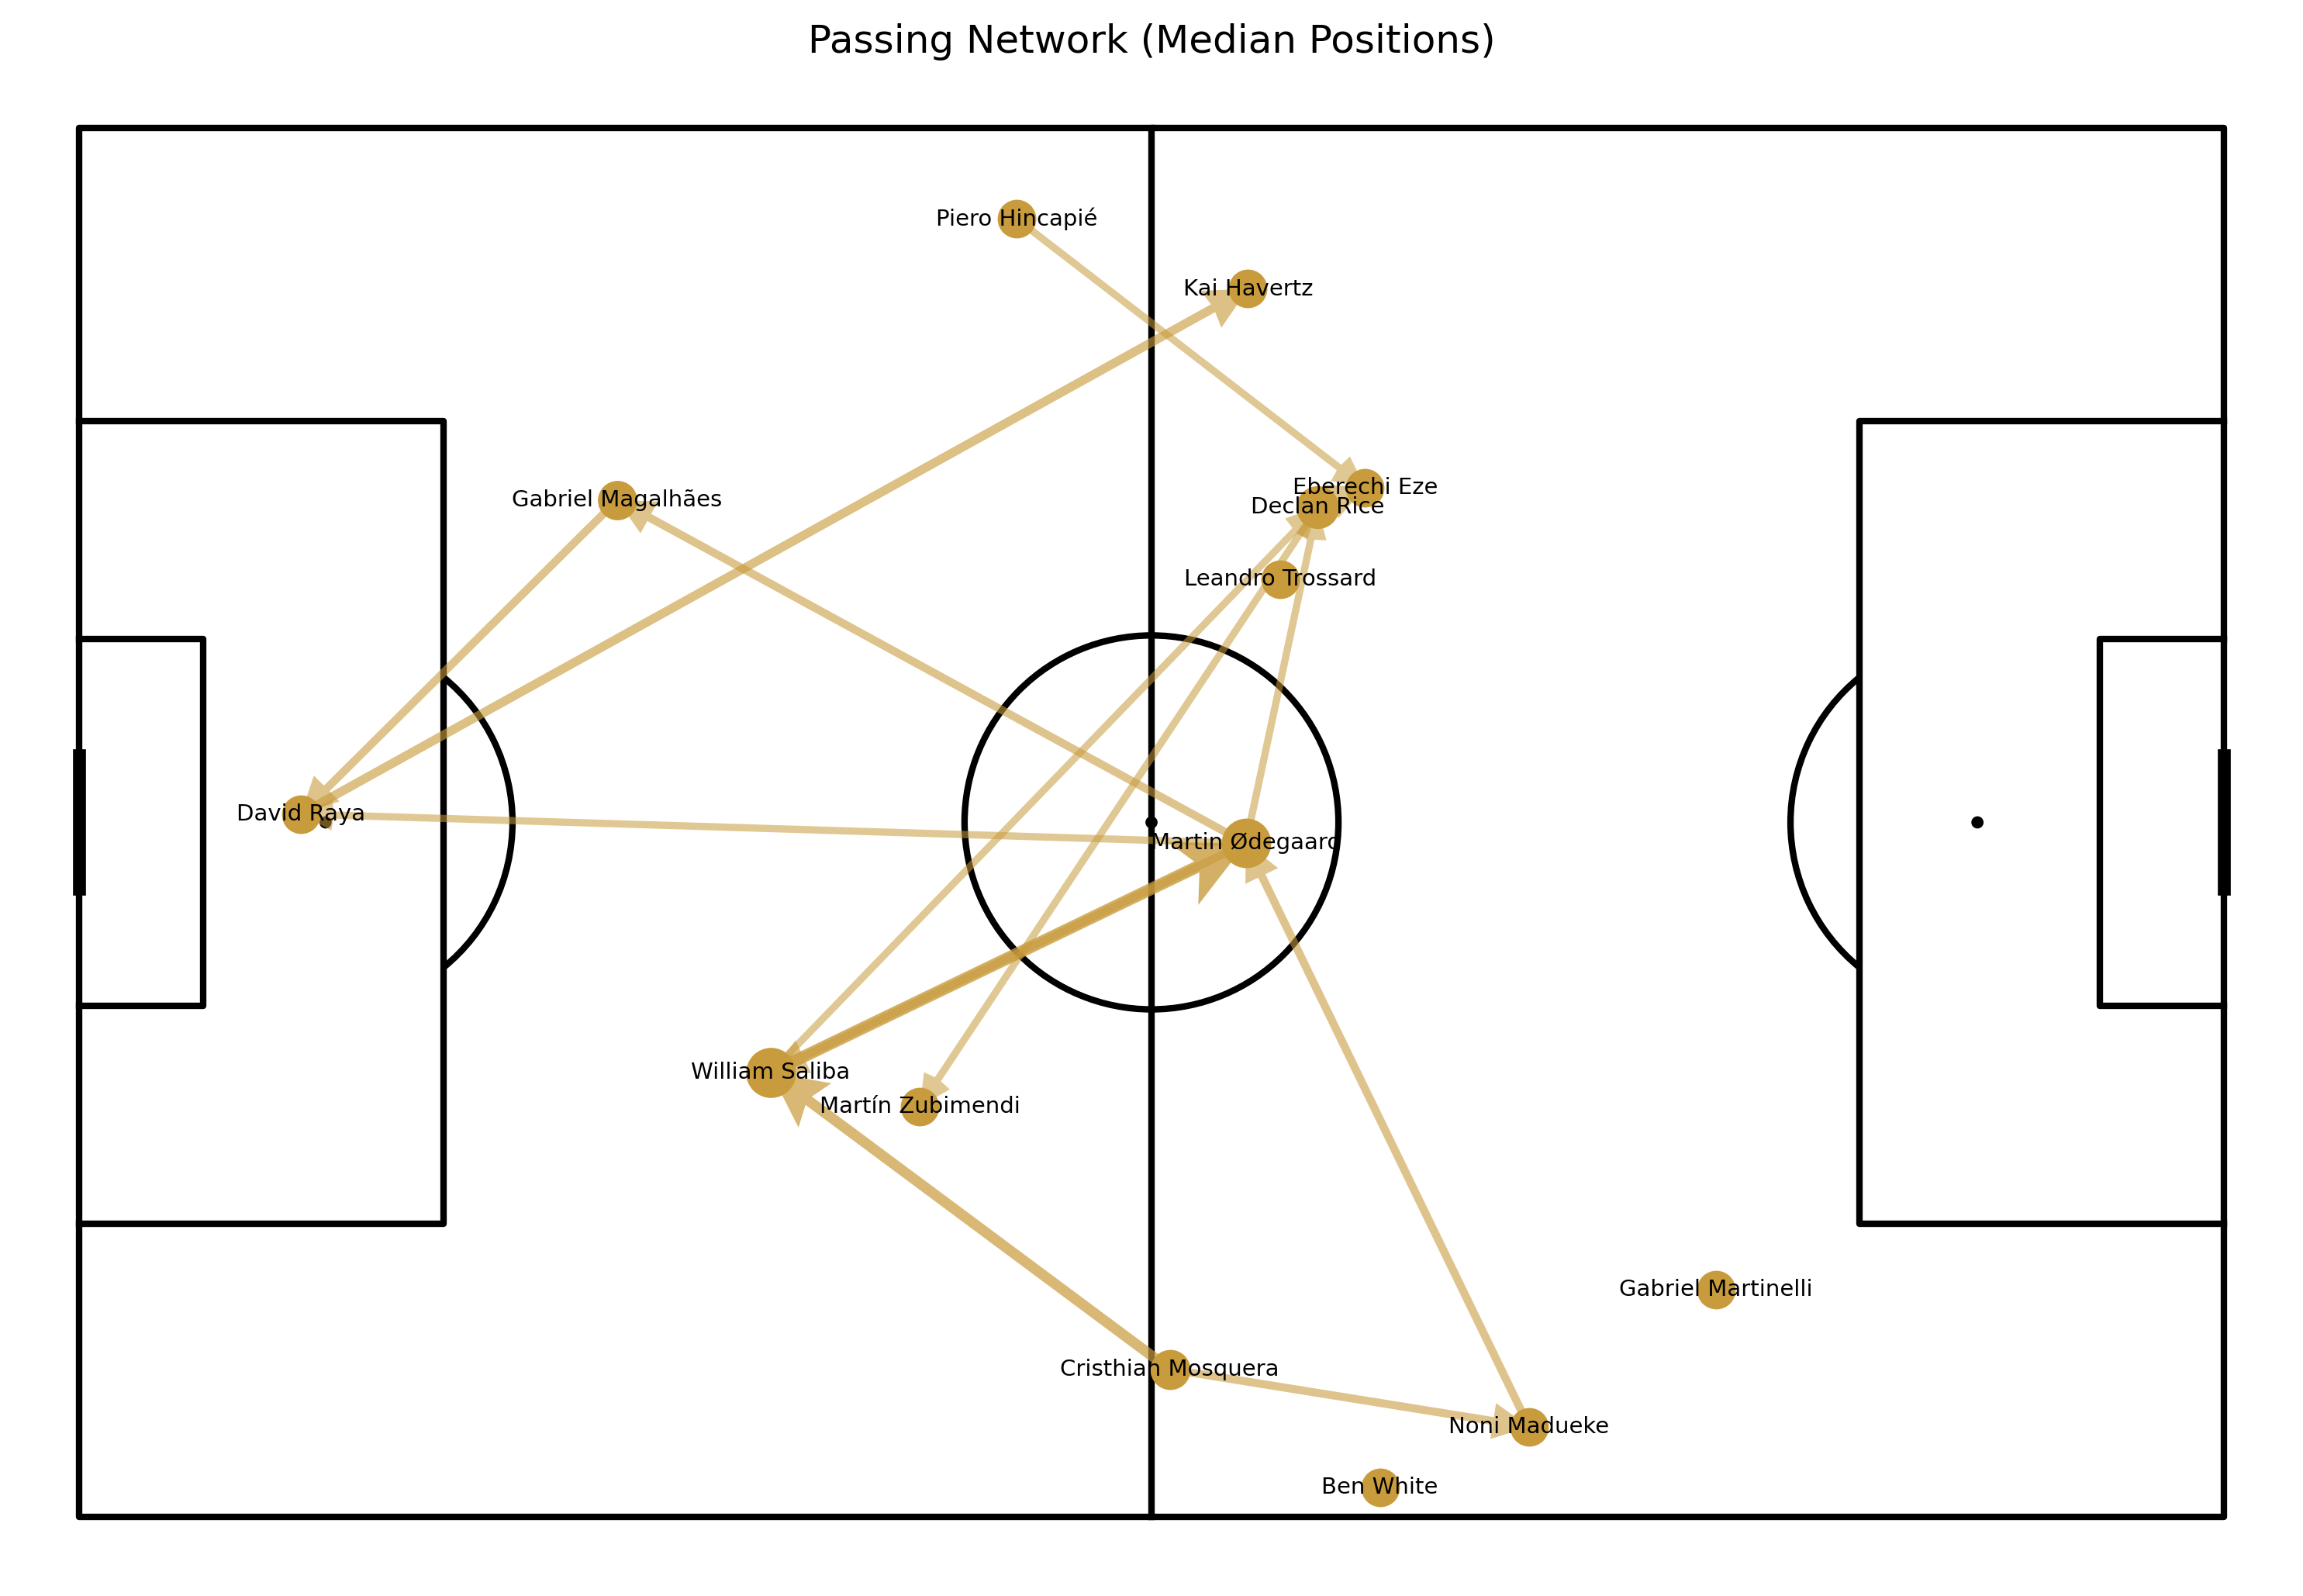
The most important metric confirmation
Negative net progression index
Negative final-third efficiency
This is decisive.
It means:
Arsenal didn’t just fail to attack
They devalued their own attacking phases
5. Frequency vs Value: The Hidden Layer That Explained the Match
This was one of the most important pre-match insights.
What the model said
City’s most frequent actions ≠ most dangerous
Arsenal’s central volume ≠ real threat
What happened
Perfect confirmation.
Manchester City:
High-frequency → left corridor
High-value → switches and central re-entry
Arsenal:
High-frequency → central circulation
High-value → rare half-space switches
The critical difference
City:
Frequent actions build the platform
Valuable actions finish the structure
Arsenal:
Valuable actions exist
But are not repeatable enough
Translation
City had:
Structure → repetition → escalation
Arsenal had:
Moments → but no structural accumulation
6. Defensive Reaction: Where the Match Was Really Decided
Pre-match expectation
City: high suppression, structural damage
Arsenal: disruption, but not collapse-inducing
Match reality
Exactly that.
Arsenal’s defense
They:
Applied pressure high
Caused:
Loss of rhythm
Temporary disruption
But did NOT:
Break City’s structure
City:
Escaped
Reorganized
Continued attacking
City’s defense
This is where the game was decided.
Especially in:
Attacking-third central zone
City’s defensive actions caused:
Forced value loss
Structural collapse in Arsenal’s next phase
This is the key difference
Arsenal:
→ disrupted
City:
→ damaged
Why it matters
Disruption slows a team.
Damage ends the attack.
City repeatedly ended Arsenal’s attacking sequences structurally.
7. Resistance-Response: The Prediction That Defined Everything
This was the most accurate part of the model.
Pre-match claim
City → progressive escape dominant
Arsenal → backward/lateral escape dominant
Match confirmation
Manchester City:
Resistance → escape forward
Maintained:
Vertical gain
xT value
Arsenal:
Resistance → retreat
Lost:
Position
Value
Momentum
Structural interpretation
City:
→ absorbs pressure and reforms attack
Arsenal:
→ absorbs pressure and resets attack
That’s the match in one sentence
8. Attack Continuity: The True Gap Between the Teams
What the model said
City would show:
Multi-wave attacking continuity
Arsenal would show:
Discontinuity under pressure
What happened
Fully confirmed.
City’s loop (repeated all match)
Progression into corridor
Resistance appears
Short recirculation (not full reset)
Immediate re-entry
This loop:
Maintained territorial pressure
Increased final-third presence
Preserved attacking density
Arsenal’s pattern
Progression attempt
Resistance appears
Backward/lateral escape
Full reset
This creates:
Loss of rhythm
Loss of pressure
Loss of structural continuity
Key consequence
City:
→ stacked attacks
Arsenal:
→ restarted attacks
9. What the Model Got Right
Let’s be precise.
1. Left corridor as City’s platform
→ Confirmed
2. Arsenal central dependency
→ Confirmed
3. City superior continuity
→ Confirmed
4. Arsenal vulnerability after resistance
→ Confirmed
5. Importance of second-wave actions
→ Confirmed
6. Frequency vs value mismatch
→ Confirmed
7. Defensive asymmetry
→ Confirmed
In short
The model did not just predict tendencies.
It predicted the mechanism of the match outcome.
10. What the Model Needs to Improve
Even with strong alignment, there are refinement opportunities.
1. Overemphasis on corridor identity vs functional usage
The model correctly identified:
Left corridor importance
But the match showed:
City’s threat came from connection between corridors
→ Improvement:
Track transition between corridors, not just endpoints.
2. Need for stronger weighting of second-wave continuity
The model identified it conceptually.
But it needs:
Quantitative emphasis
→ Because:
Second-wave behavior decided the match
3. Defensive impact needs sharper classification
Not all pressure is equal.
We need clearer distinction between:
Rhythm disruption
Structural damage
→ This is a major upgrade opportunity
4. Rare high-value routes vs dominant structure
Arsenal had:
High-value routes (half-space switches)
But:
Too rare to matter
→ Model should:
Weight repeatability of value, not just value itself
11. Final Insight: The Match Was Lost After Contact
This match was not about:
Who had the ball
Who reached the final third
Who created more entries
It was about:
What happens after the first moment of resistance
Manchester City
Survived contact
Reorganized
Continued attacking
Arsenal
Faced contact
Lost structure
Restarted
That difference compounds
Over 90 minutes:
One team builds pressure
The other relieves pressure
Eventually:
The pressure breaks the game
12. What This Means Going Forward
For Manchester City
Structure is not just strong — it is resilient
Can:
Absorb pressure
Maintain attacking continuity
Dangerous even without immediate verticality
For Arsenal
Structure is not the issue
Continuity is
They need:
Better resistance-response behavior
More stable second-wave support
Less reliance on central access alone
Conclusion: The Model Didn’t Just Predict the Match — It Explained It
This was not a coincidence.
The pass network + xT framework:
Identified the key zones
Identified the key mechanisms
Identified the key asymmetry
And most importantly:
It identified where the match would break.
Final takeaway
If you want to understand football structurally:
Stop asking:
Who had the ball?
Start asking:
What happens after resistance?
Because that’s where matches are actually decided.
Want more analyses like this?
I break down matches using:
Pass network structure
xT progression
Graph theory (centrality, connectivity)
→ To reveal patterns you don’t see on screen.
Subscribe to get:
Weekly deep-dive matchups
Post-match structural reviews
Live betting insights based on real structural shifts