


Estimated reading time: 12–14 minutes.
Monaco sit at the top of Ligue 1 with 14 points from six matches: four wins, two draws and no defeats. The FotMob league table, checked on 14 October 2026, places them one point ahead of Lille and Rennes, with ten goals scored and five conceded. That is a strong opening to the campaign, but a league position cannot explain how a team moves the ball forward, which routes become threatening or where its construction tends to stall.
Those questions are the starting point for this Monaco build-up analysis. Using 202 possessions that began in the first third across six matches, I grouped similar sequences, examined their passing patterns and compared the threat they accumulated in a designated target zone.
The target zone covers the penalty area and extends three metres beyond its boundaries into the surrounding pitch.
The aim is to show how football data analysis can turn a collection of possessions into recognisable behaviours, giving an analyst a useful team profile before beginning a more detailed video review.
Monaco provide the example, but the approach can be applied to any team with suitable event data. It can describe how a side progresses in possession and, with the perspective reversed, the types of progression it allows opponents. Even this relatively brief exploration produces specific questions about left-sided progression, circulation trapped on the defensive right and the importance of connecting different parts of the pitch.
Why analyse possessions that start in the first third?
A possession recovered close to the opposition penalty area begins with a very different problem from one starting near a team’s own goal. Combining them without distinguishing their starting positions can blur the behaviour we want to study: some attacks are already close to dangerous territory before the first pass, while others must travel through most of the pitch. For this analysis, restricting the sample to possessions beginning in the first third makes the subject more precise: how does Monaco construct its progression from deep positions?
That restriction applies to the beginning of the possession, not to every subsequent pass. Once a qualifying possession advances into midfield or the final third, its successful passes remain part of the analysis. The analysis covers 928 successful passes across 202 possessions that began in Monaco’s defensive third. Every subsequent successful pass remains in the sample, allowing us to follow those sequences as they develop through midfield and into attacking areas.
The resulting sample includes short spells that barely leave the defensive third and longer constructions that reach advanced areas. That variation is useful because it allows us to compare different ways a build-up develops, rather than selecting only successful attacks. It also means that a profile’s name describes the sequence observed in the data; it should not automatically be read as the team’s intention when the possession began.
How KMeans identifies football build-up patterns
KMeans groups observations that resemble one another across a chosen set of characteristics. Here, each observation is a possession, described by eleven variables: nine spatial shares covering three thirds and three channels, the number of triangulations and the duration of the sequence. Together, these describe where the passing activity is distributed, how long the possession lasts and the presence of a particular combination pattern.
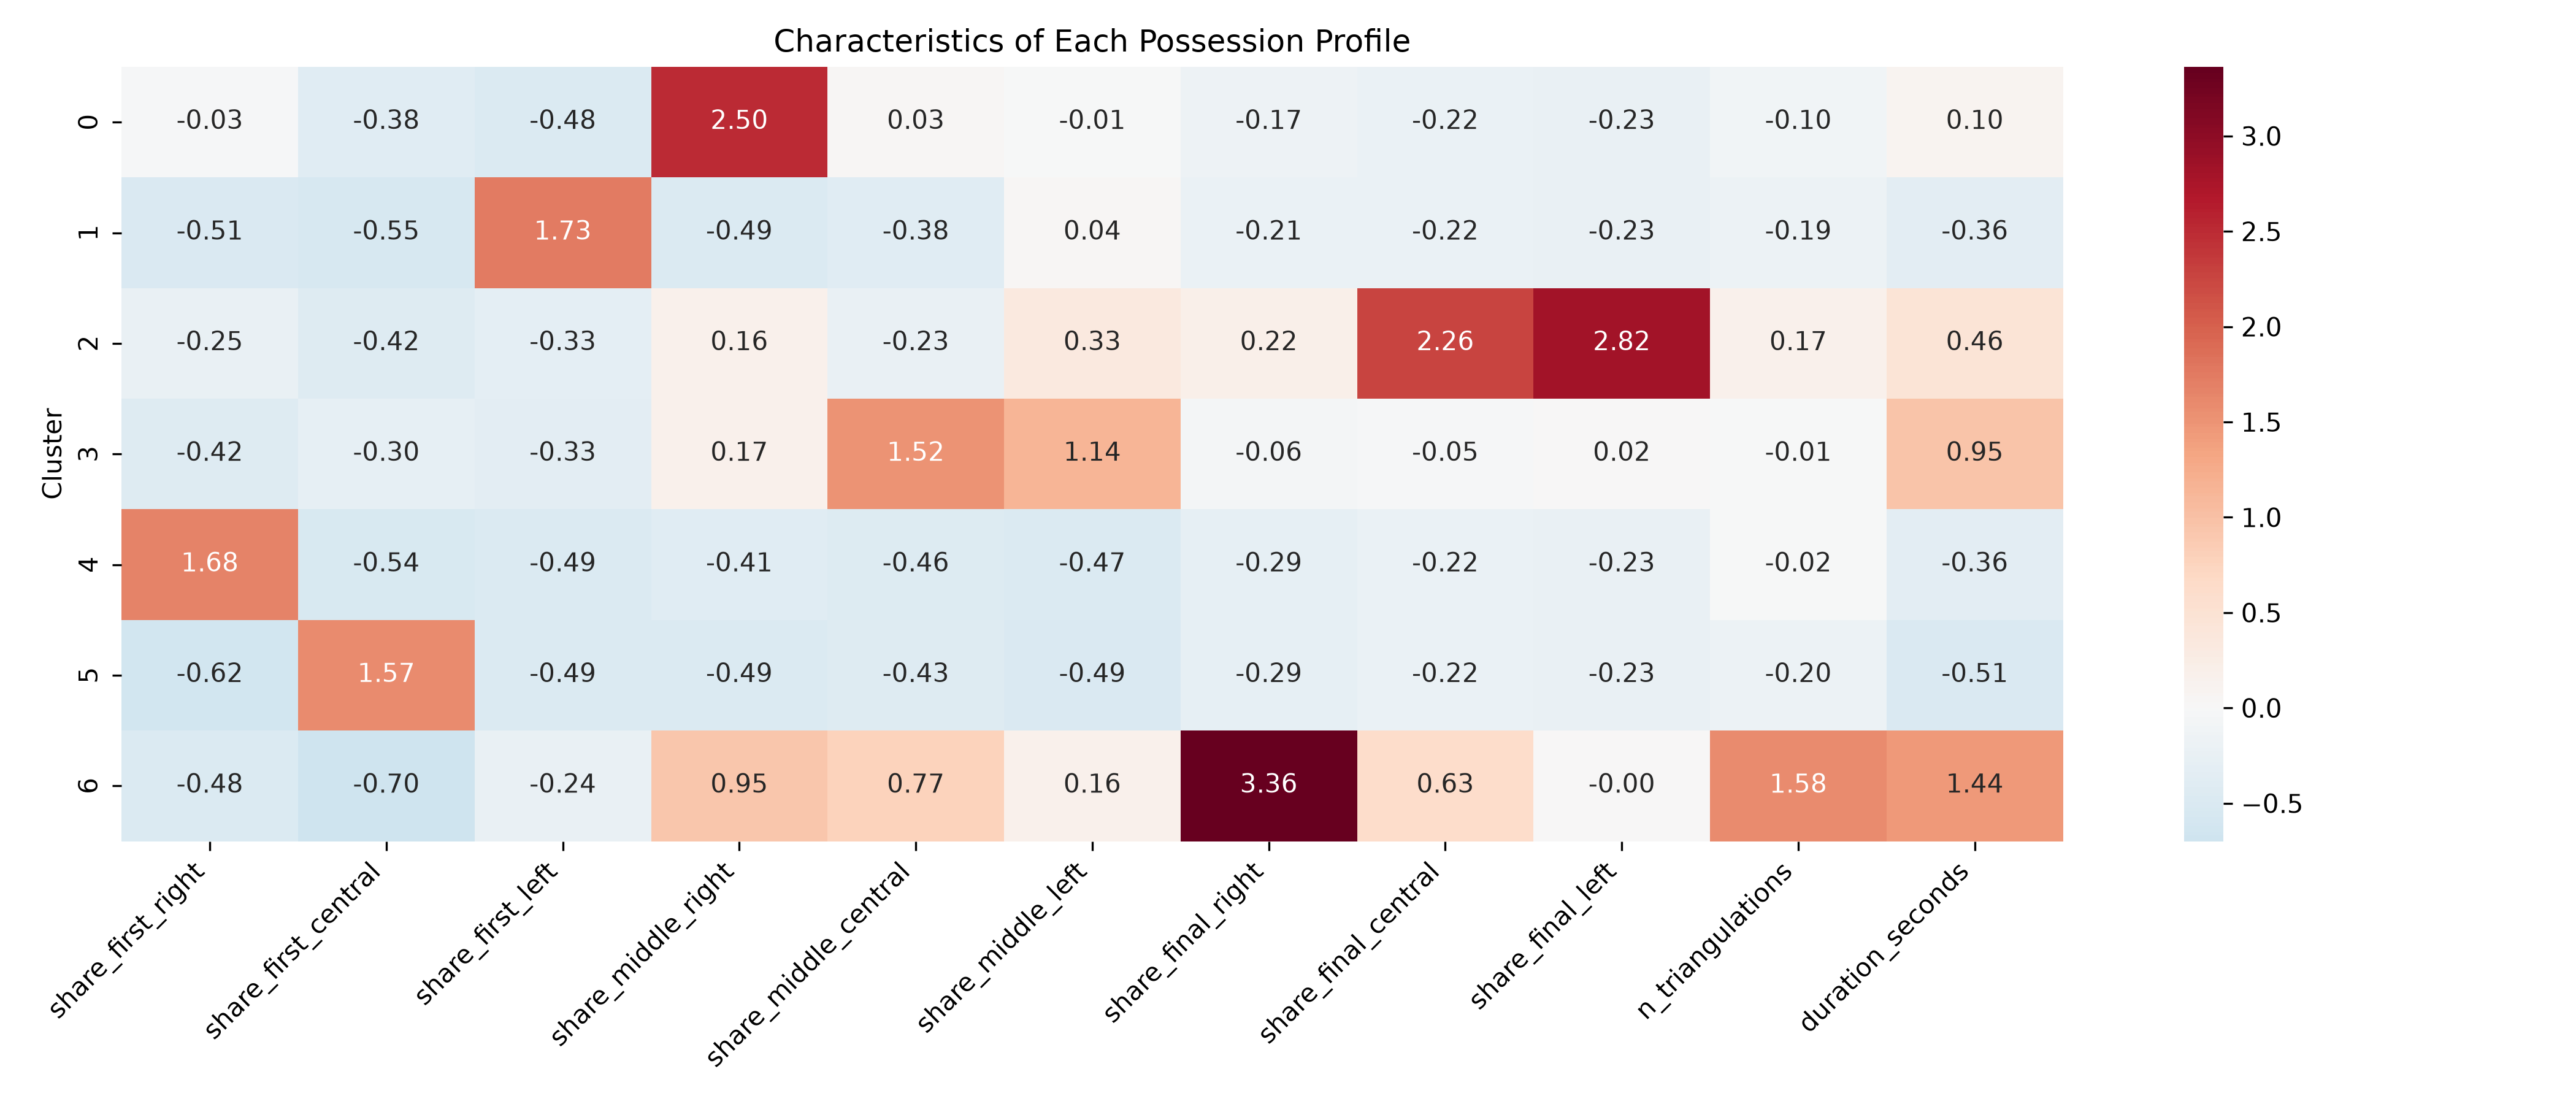
Before grouping the possessions, the variables are standardised so that their different measurement scales do not dominate the comparison. KMeans then assigns each possession to the nearest group centre and repeatedly adjusts those centres to improve the grouping. In football terms, the result is a set of families: possessions concentrated on the defensive right, sequences circulating through central-left midfield, or longer constructions extending across several thirds.
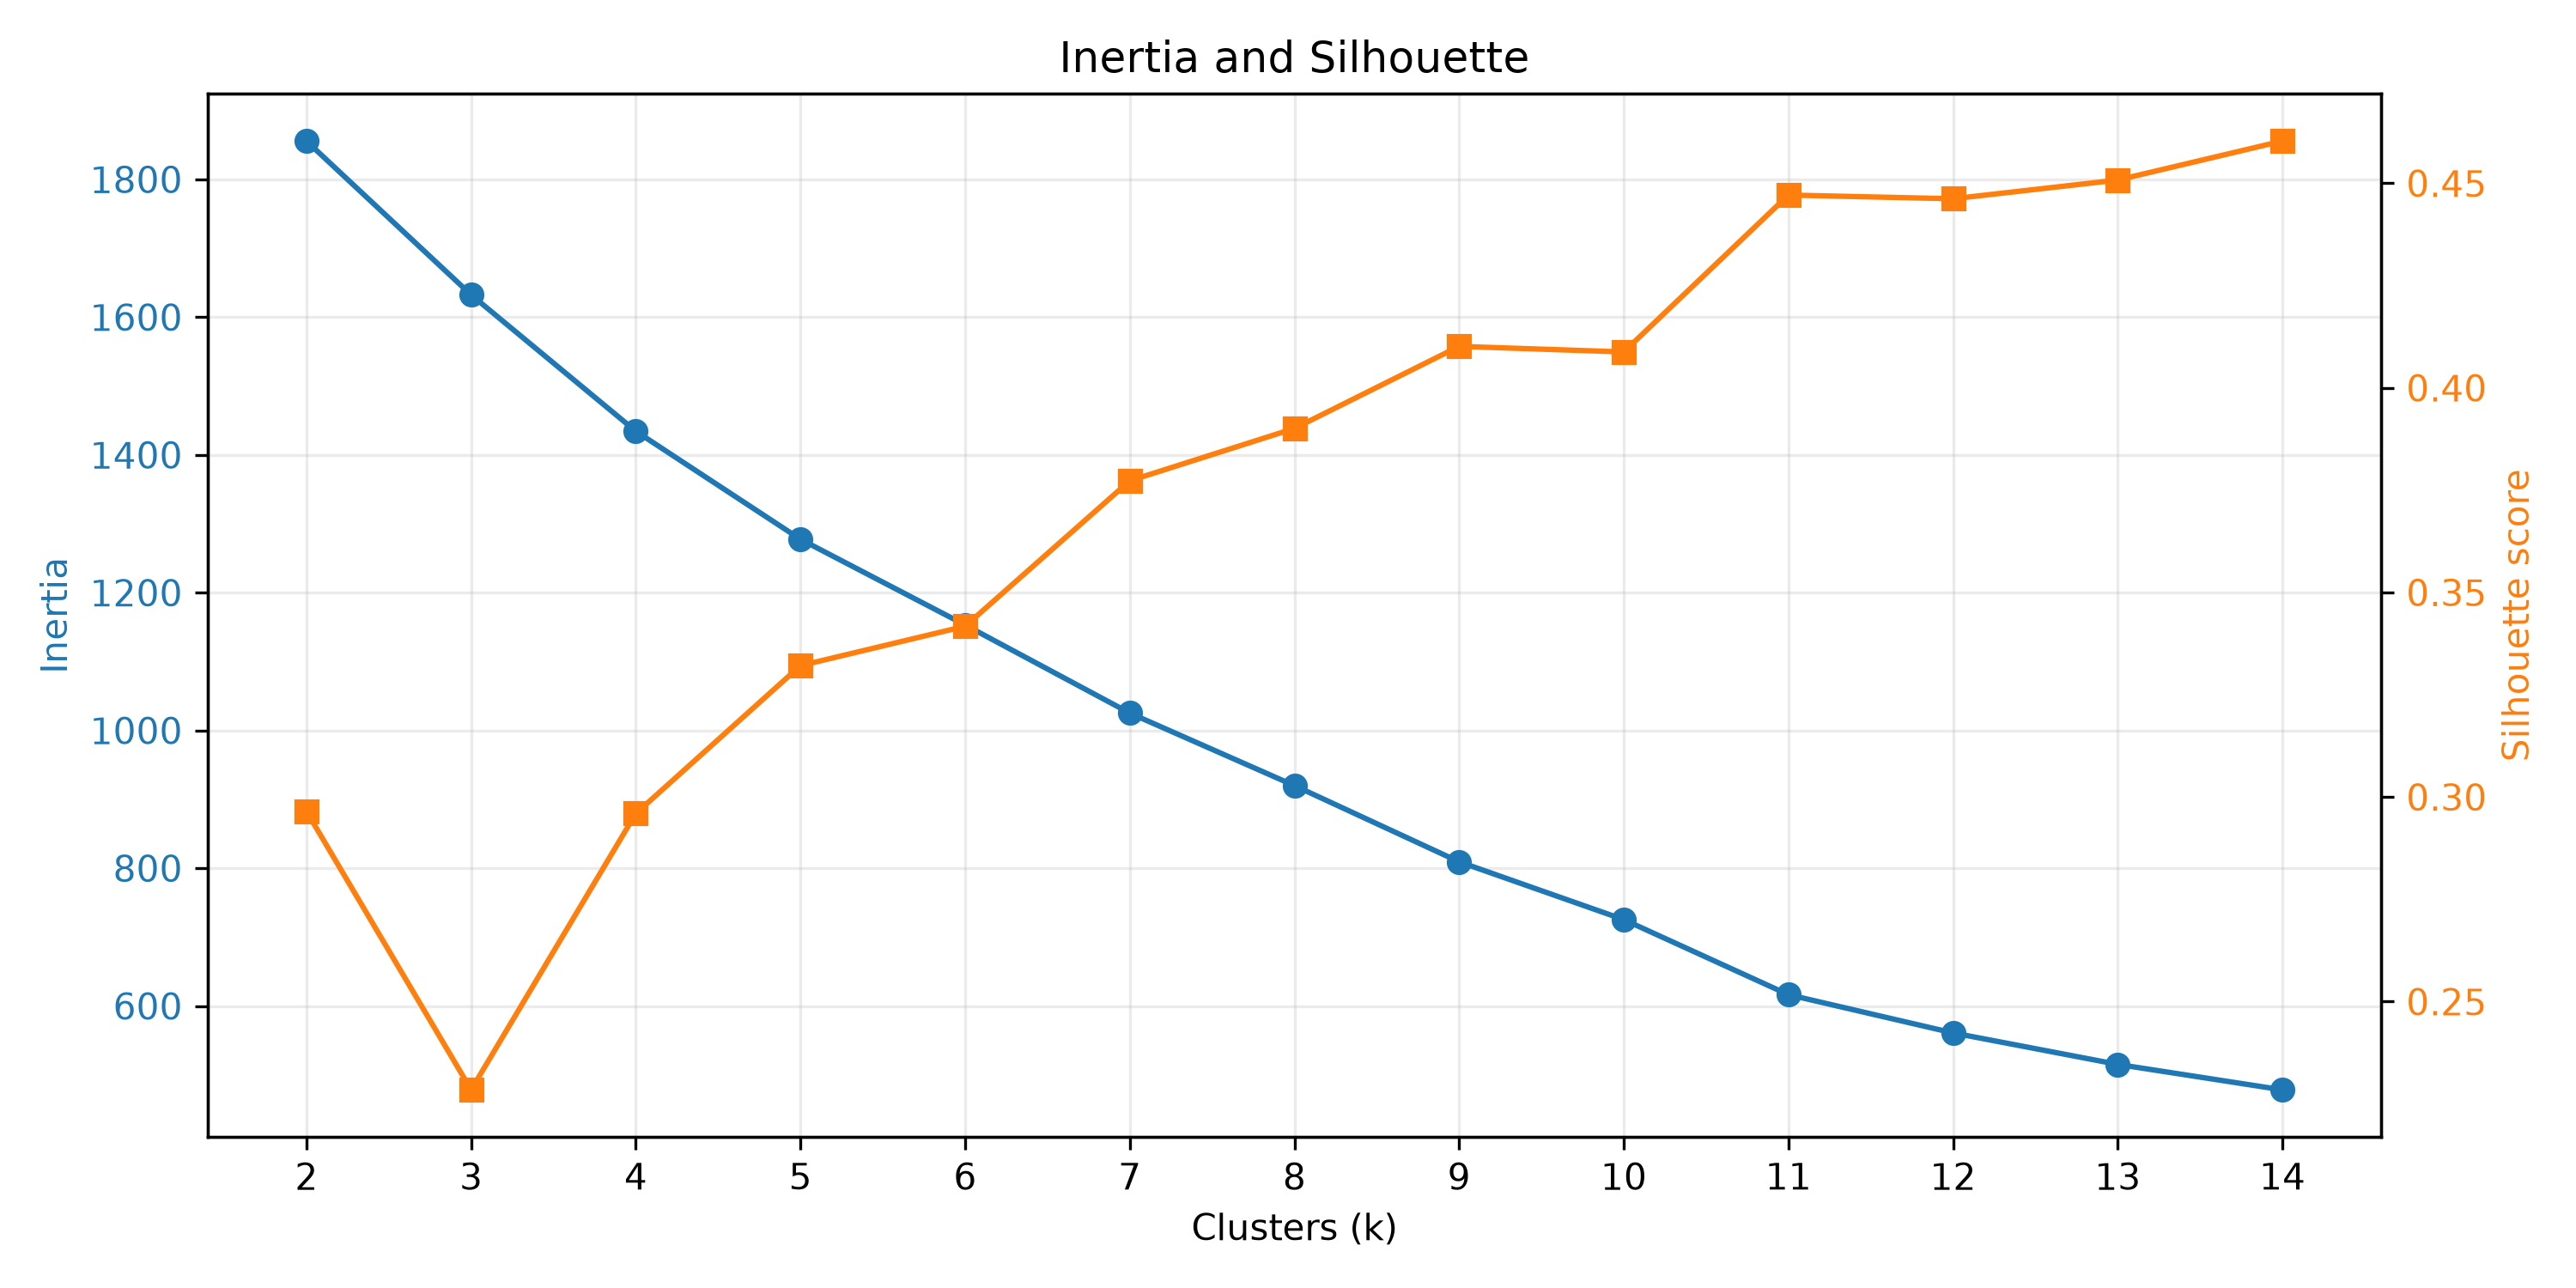
Seven clusters were retained because they provided a useful balance between separation and football interpretation. Inertia describes how tightly observations sit around their group centres, while silhouette assesses how well they fit their own group compared with alternatives. These diagnostics help assess the grouping, but the practical justification also comes from the heatmap: the seven clusters express recognisable differences without turning this introductory analysis into a catalogue of increasingly narrow subtypes.
The heatmap displays those characteristics on a standardised scale. Red indicates a value above the sample average and blue a value below it; neither colour means inherently good or bad football. Crucially, xT was not one of the eleven clustering variables. It is used afterwards to examine how the identified profiles relate to threat, while remembering that a profile defined partly by advanced territory will naturally have opportunities to register higher threat there.
Seven profiles, very different progression outcomes
The first useful distinction is between frequency and danger. A behaviour can account for a large share of a team’s possessions while contributing little threat in the target zone, and a relatively uncommon pattern can carry a disproportionate share of that threat. Monaco’s sample makes this contrast particularly clear: the three profiles concentrated in the first third contain 130 of the 202 possessions, or 64.4%, but contribute only about 1.3% of the recorded target-zone xT.
The seven profiles differ substantially in frequency, duration and threat. Central First-Third Quick Build-Up is the largest group, with 47 possessions averaging just 2.5 seconds, but only one registers target-zone xT. Right-Side First-Third Retention contains 43 possessions, while Left-Side First-Third Short Build-Up contains 40. Both average approximately 5.6 seconds, and neither produces target-zone xT in this sample. Together, these profiles describe frequent sequences whose passing activity remains predominantly close to the defensive starting area.
The midfield profiles show greater progression, although their attacking returns remain uneven. Central-Left Midfield Circulation contains 32 possessions averaging 31.8 seconds, with positive target-zone xT in four of them and an average contribution of 0.0153 per possession. Right-Lane Progression into Midfield contains 17 possessions averaging 14.8 seconds, with positive contributions in three and an average of 0.0098. The central-left group therefore accumulates more threat per possession on average, but its longer circulation does not consistently translate into valuable receptions inside the target zone.
The strongest attacking returns belong to two smaller groups. Central-Left Final-Third Progression contains twelve possessions averaging 21.8 seconds, ten of which register target-zone xT, with an average of 0.0907 per possession. Sustained Multi-Third Progression contains eleven possessions averaging 41.6 seconds, with positive contributions in five and an average of 0.0451. These figures distinguish a comparatively consistent route into threatening central-left areas from a longer, more sustained form of progression whose attacking output varies more between possessions.
The central first-third profile is the most frequent, with 47 possessions, but also the shortest. Its 83 successful passes amount to fewer than two per possession, and almost all its average spatial share remains in the first third. The label “quick build-up” therefore describes short duration; it does not mean these were consistently fast, successful attacks travelling from one end of the pitch to the other.
At the other end of the distribution, the two most threatening profiles contain just 23 possessions combined. Central-Left Final-Third Progression and Sustained Multi-Third Progression represent 11.4% of the sample yet account for approximately 69.8% of its accumulated target-zone xT. Their recorded entry counts also add up to 14 of the dataset’s 23 entries, providing another view of how concentrated the attacking output is within these groups.
What the xT boxplot says about Monaco’s most dangerous build-up
The metric in the boxplot sums the xT values at the destinations of passes inside the target zone, separately for each possession. It captures the accumulated value of those receiving locations rather than the net xT gained between the start and end of a pass. Several receptions can contribute within one possession, so the total should not be interpreted as a probability of scoring or as a count of chances created.
This distinction matters when reading the distributions. A zero means the possession registered no accumulated value under this target-zone measure; it does not mean every action in the sequence was useless. Equally, a high total describes valuable passing destinations within the defined zone, without telling us on its own whether the move ended in a shot. Within those boundaries, the boxplot gives a clear comparison of which build-up profiles repeatedly connect deep starts with threatening territory.
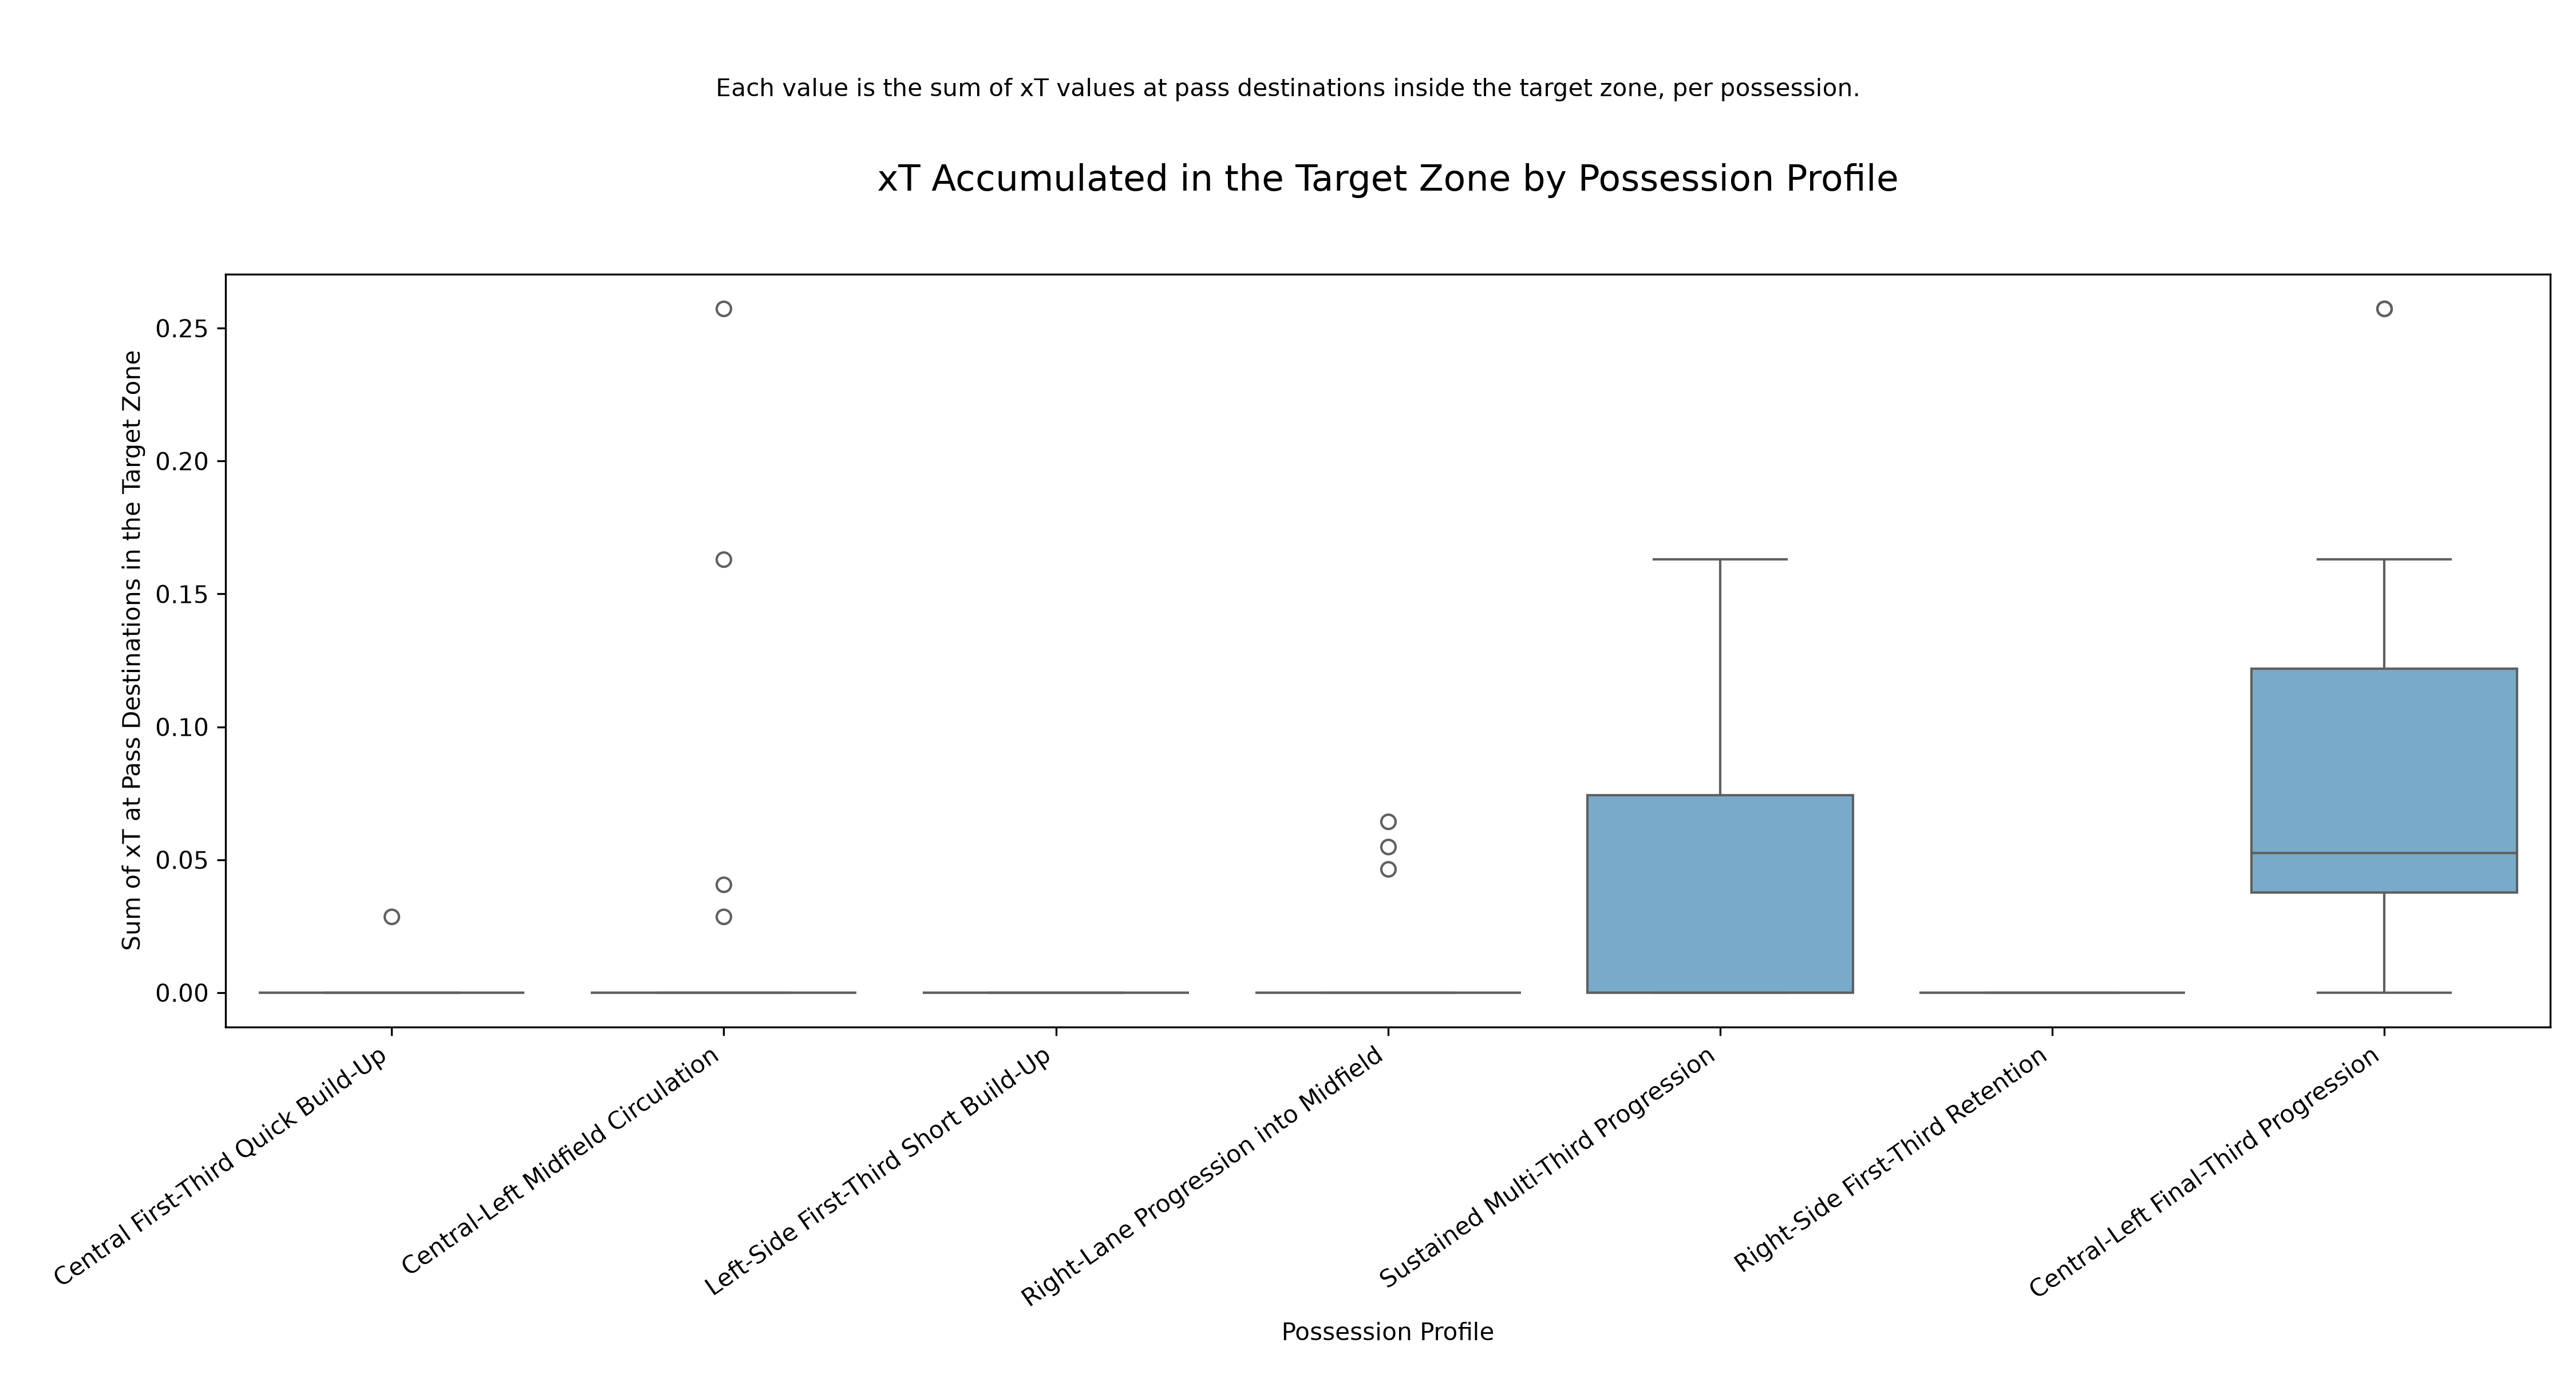
Central-Left Final-Third Progression stands out most clearly. Ten of its twelve possessions record positive target-zone xT, its median is approximately 0.0525, and its average is 0.0907. The profile contributes roughly 48% of the entire sample’s accumulated target-zone xT despite containing fewer than 6% of the possessions. Its importance is therefore visible both in the distribution and in its overall contribution.
Sustained Multi-Third Progression provides a second route to danger, but with a different degree of consistency. Five of its eleven possessions produce positive target-zone xT, giving it a median of zero even though the upper part of the distribution reaches substantial values. Its average of 0.0451 is around half that of the central-left final-third profile, while its total contribution is about 22% of the sample. Both profiles matter, but the first reaches positive target-zone output much more regularly within its small group.
The Central-Left Midfield Circulation profile illustrates why individual high values need to be read alongside the whole distribution. It contains a possession with approximately 0.2575 target-zone xT, comparable to the highest observation in the central-left final-third group, yet only four of its 32 possessions register a positive value. Those occasional dangerous sequences are worth reviewing, but they do not make every long spell of midfield circulation equally threatening.
Longer possession does not automatically mean greater threat
The comparison between the two central-left profiles is especially revealing. Midfield Circulation averages 31.8 seconds and 8.7 successful passes per possession, whereas Final-Third Progression averages 21.8 seconds and 7.5 passes. Despite being shorter and involving fewer successful passes, the final-third profile produces almost six times as much target-zone xT per possession on average.
This is a useful reminder of what a possession count or passing total can conceal. Monaco’s 279 successful passes in the midfield-circulation group are the largest total of any profile, but that volume does not translate into the strongest target-zone output. The distinction lies in where the sequence develops and the receiving locations it reaches, rather than simply how long Monaco keep passing.
The longer Sustained Multi-Third Progression profile tells a complementary story. Its possessions average 41.6 seconds and 13.2 successful passes, with eight recorded triangulations across eleven sequences. That is a different way of moving forward from the shorter central-left final-third pattern: more sustained combination, a broader distribution across thirds and greater variation in whether the possession eventually accumulates target-zone threat.
Reading the pass flow: where Monaco progress and where they stall
The pass-flow maps add the spatial detail needed to interpret those differences. Their blue shading represents the number of successful passes originating in each cell, using the same colour scale across profiles. The black arrows represent average passing direction and average pass length within each cell, allowing us to compare the main tendencies of the different groups without plotting every individual event.
Because these are aggregated maps, an arrow does not represent one specific move and the full set of arrows should not be followed as a single possession. A pale cell can still receive passes, while a dark one tells us that many passes started there. This is particularly relevant near the target zone: a team can pass into an advanced area without producing many successful passes out of it, so receiving threat and pass-origin density answer different questions.
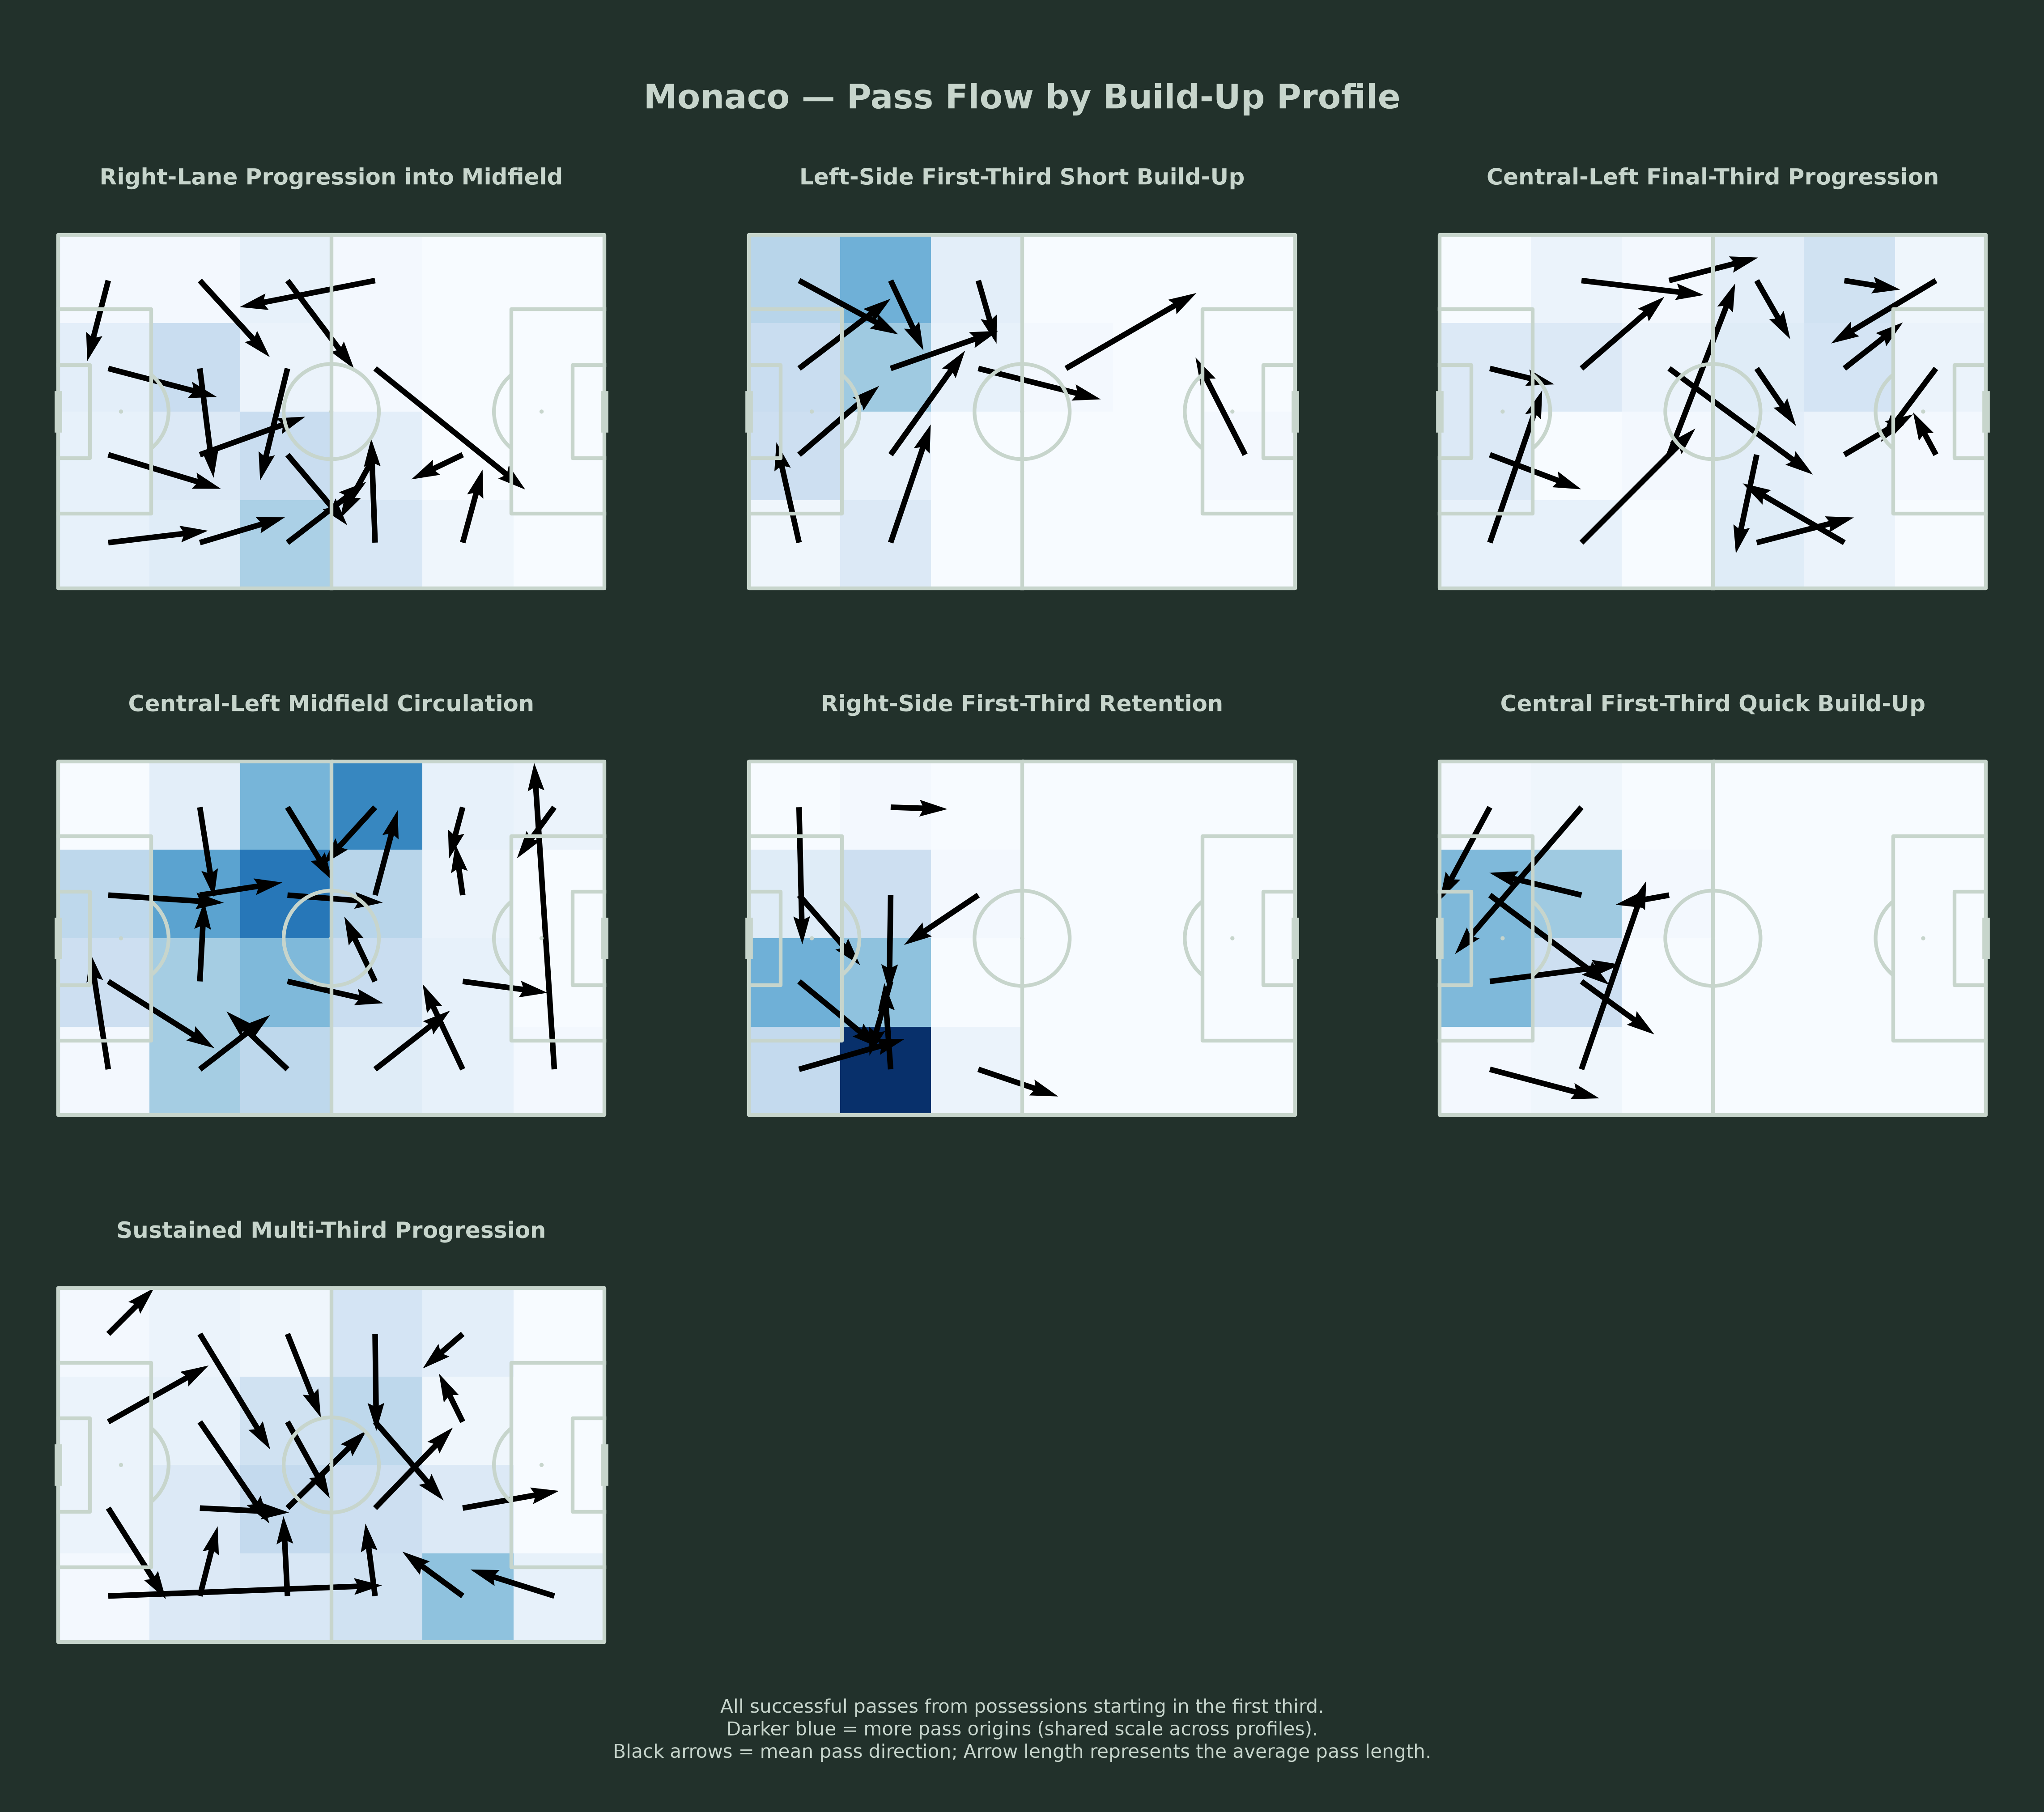
The Right-Side First-Third Retention profile provides the clearest example of restricted progression. It contains 43 possessions and 132 successful passes, yet records no target-zone entries and no target-zone xT. Its mean spatial share is approximately 98.6% in the first third, and the flow concentrates heavily around the defensive right. The map and the possession-level numbers describe the same limitation: these sequences rarely develop beyond their initial area.
This supports a specific tactical observation about the sample: when Monaco remain confined to the right flank in their own third, their progression struggles to develop. It does not establish whether the opponent forced that restriction, whether Monaco deliberately recycled possession or whether another event interrupted the sequence. Those are questions for video, but the data have already identified a coherent group of possessions in which to investigate them.
It would also be a mistake to turn that observation into a general claim that Monaco cannot progress on the right. Right-Lane Progression into Midfield contains 17 possessions, with three recorded target-zone entries and positive target-zone xT in three sequences. The sustained profile also has a strong final-third-right characteristic in the heatmap. The relevant distinction is between being confined to the defensive right and using the right side as part of a progression that reaches other areas.
Monaco’s leftward tendency needs a territorial distinction
Taken together, the flow maps suggest a tendency for important progression routes to develop towards the left, particularly through central-left midfield and into central-left final-third areas. The strongest target-zone xT profile fits that reading: its heatmap values stand out in the central and left channels of the final third, while its flow extends well beyond the defensive starting area. The spatial description and the threat distribution reinforce one another.
However, the Left-Side First-Third Short Build-Up group contains 40 possessions and produces no target-zone xT. Simply placing the ball on the left does not make a sequence dangerous, just as using the right does not automatically prevent progress. What differentiates the more threatening leftward route is its connection with advanced territory: moving through and beyond midfield into receiving locations that carry greater value.
The contrast between these groups is useful for opposition analysis because it makes a broad observation more actionable. “Monaco tend to progress left” is a starting point, while “which connections allow Monaco to move from a deep start into central-left final-third receptions?” is a question that can guide a focused review. It directs attention towards the development of the possession instead of treating a flank preference as a complete tactical explanation.

Connecting the flanks: a hypothesis worth taking to video
The broader circulation visible in the more developed profiles raises another useful hypothesis: allowing Monaco to connect both flanks may help them escape restricted areas and sustain threatening progress. The Sustained Multi-Third Progression map is especially relevant because its activity extends across several zones, and its longer sequences include more triangulations than the other groups. This suggests combinations and connections worth inspecting rather than isolated forward passes alone.
There is a practical difference between observing activity on both flanks across a group and demonstrating a switch from one flank to the other inside an individual possession. The flow establishes the former; a sequential review is needed for the latter. The next question is therefore whether Monaco’s dangerous possessions use lateral connections to create a new forward route, and at what stage of the build-up those connections become decisive.
That investigation can cover the defensive, middle and final thirds without assuming the effect is identical in all three. Video can show whether a switch changes the opponent’s shape, opens a receiving lane or merely recycles the ball without creating an advantage. The cluster analysis has already narrowed the search to the profiles most likely to make that comparison useful.
Using possession clusters to guide video analysis
Even at this introductory level, the analysis provides a grounded initial profile: frequent short sequences near the defensive starting area, restricted progression in the defensive-right retention group, a threatening central-left final-third route and a longer combination-based alternative. That is enough to organise a meaningful video session. Instead of watching six matches with a general instruction to study Monaco’s build-up, the analyst can select possessions that represent each behaviour and compare how they unfold.
For the defensive-right group, the review can examine available passing options, the opponent’s positioning and the moments when progression breaks down. For the central-left final-third group, it can identify which connections make advanced receptions possible and whether the same mechanism recurs. Comparing those clips with the quieter midfield-circulation possessions would also help explain why some sequences reach valuable territory while others accumulate passes without the same return.
This makes the analysis more focused without pretending that a cluster label explains everything. Event data locate and quantify the pattern; video reveals the surrounding movements, pressure and decisions. A useful team profile emerges from that combination, with the initial statistical picture giving the analyst specific observations to test rather than a long list of unstructured impressions.
Analysing progression for and against any team
The same framework can be applied from the defensive perspective by selecting opponents’ possessions against the team being studied. An analyst could then identify which forms of build-up the team regularly contains and which ones are associated with valuable receptions or entries into the target zone. This moves the discussion beyond how a side attacks and towards the kinds of progression its defensive behaviour permits.
The comparison requires a consistent starting-point rule, spatial definition and passing direction. If profiles are to be compared directly between teams, the groups should also come from a common reference or be carefully matched by their characteristics; a cluster number has no fixed tactical meaning across independently fitted models. With those conditions in place, the method can support both a team’s own development work and preparation for a specific opponent.
That wider application is the purpose of this case study. Monaco’s patterns are interesting in their own right, but the repeatable process is the more valuable result: select a coherent set of possessions, group their characteristics, interpret the profiles and examine the threat associated with each one. The findings then lead back to the match, where the analyst can investigate the football behind the numbers.
Monaco vs Toulouse: taking the analysis into the Football Hacking Web App
The video below takes the discussion into the Football Hacking Web App using Monaco’s 2–2 home draw with Toulouse. I use the match to explore insights from the available tools and show how a broader data-led team profile can provide a starting point for examining an individual game. The purpose is to connect the patterns discussed here with a practical analysis workflow, while keeping the focus on team behaviour.
What this Monaco build-up analysis reveals
Across 202 possessions, clustering separates behaviours that a single passing total would merge together. The most frequent profiles spend much of their activity near the starting area, while a small group of central-left final-third and sustained multi-third possessions carries most of the accumulated target-zone threat. The boxplot distinguishes consistent danger from occasional high-value sequences, and the flow maps show where those differences take shape on the pitch.
There is already enough here to form a useful initial view of Monaco and make the next stage of analysis more deliberate. Investigate the restriction on the defensive right, trace the routes into central-left advanced areas and examine how connections between flanks support the more developed possessions. That is what makes clustering valuable in football analysis: it gives recurring behaviours a measurable form and helps us return to the video knowing what deserves a closer look.