

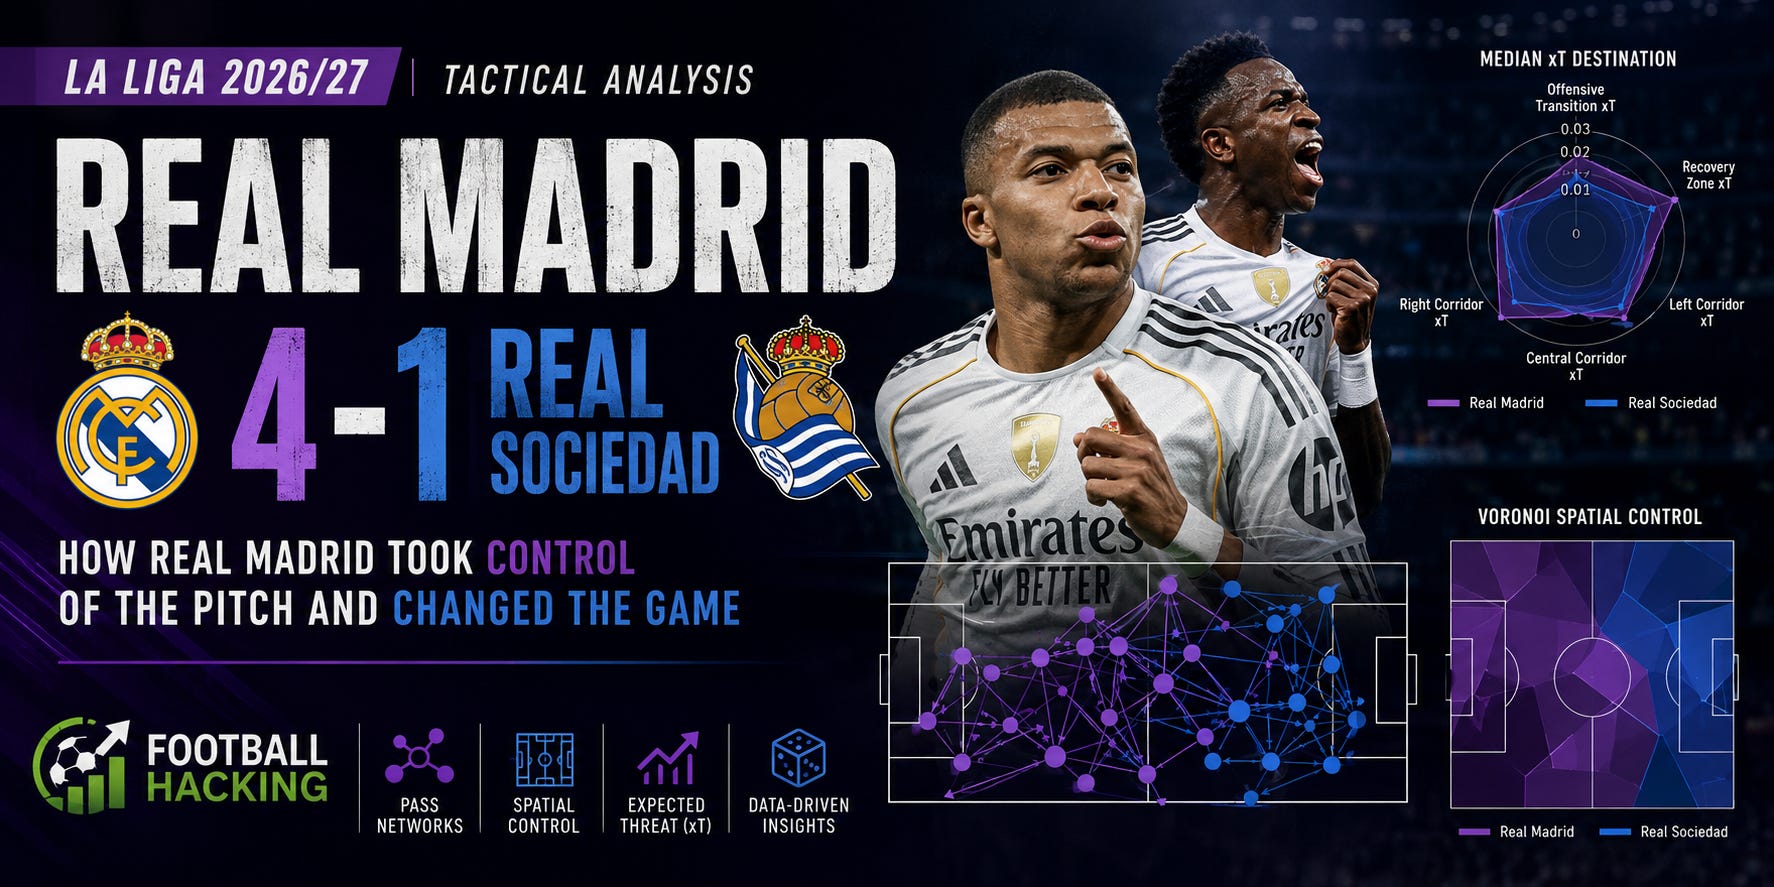
Disclaimer: No match footage, video, photographs, or external information were used in this analysis. The conclusions below are based exclusively on the Football Hacking data shown in the attached visualizations: open-play pass networks, Voronoi spatial control, Median xT Destination, Offensive Transition xT, Recovery Zone xT, corridor xT and five-minute Network Health windows. Set pieces are excluded from the pass-network and spatial analysis.
Real Sociedad competed for territory. Real Madrid controlled what happened inside it.
A 4–1 scoreline can easily suggest a one-sided match from beginning to end. The spatial and network data tells a more nuanced story.
Real Sociedad had periods in which they occupied a remarkable amount of the pitch, particularly during the first half. Their Median xT Destination profile was also competitive — and in some dimensions superior — showing that their possession was not simply sterile circulation far from dangerous areas.
But territorial occupation and control of the match are not the same thing.
Real Madrid repeatedly managed to maintain valuable connections through the central and inside channels while positioning their most advanced players in areas from which the structure could quickly become threatening. As the match progressed, Madrid increasingly imposed their own spatial organisation.
That distinction helps explain why the final score became so large.
0’–25’: Real Sociedad occupy space, but Madrid find the more dangerous attacking positions
The opening 25 minutes are perhaps the clearest warning against reading possession structure superficially.
Real Sociedad’s Voronoi map shows extensive blue territory across significant portions of midfield. Their structure stretches vertically and horizontally, with Jon Aramburu occupying the high left side of Sociedad’s structure and Jon Martín positioned much deeper on the opposite side, helping create width around the central cluster.
Madrid’s shape is different.
Rather than trying to dominate every square metre, Real Madrid establish a more compact occupation around midfield and then place players beyond that concentration.
Jude Bellingham occupies the left half-space/high central channel, positioned between the midfield core and the advanced line. Kylian Mbappé operates much higher in the right half-space and central attacking zone, already disconnected enough from the midfield cluster to give Madrid depth.
That matters.
Madrid do not need their entire network to advance simultaneously. Their structure already contains players positioned beyond the densest area of Sociedad’s occupation.
The xT radar reinforces the competitiveness of this opening phase. Real Sociedad show particularly strong Recovery Zone xT, while their central and left-corridor values remain healthy. Madrid, meanwhile, retain a strong Left Corridor xT profile.
So this is not yet territorial domination by Real Madrid.
It is closer to selective occupation: Sociedad cover more space, while Madrid preserve access to strategically valuable areas.
25’–46’: Sociedad’s territorial presence grows — but Madrid’s vertical structure survives
The second part of the first half produces an interesting spatial transformation.
Real Sociedad expand their control across much of the pitch. Blue Voronoi territory becomes especially prominent through midfield and toward both flanks. Their Right Corridor xT also rises noticeably, becoming one of the strongest elements of their first-half profile.
Yet Madrid maintain something extremely important: vertical reference points.
Vinícius Júnior moves into a very high position on Madrid’s left attacking corridor, stretching Sociedad’s structure toward its own defensive territory. Kylian Mbappé remains advanced through the opposite inside channel, giving Madrid another high outlet rather than allowing the team to collapse entirely around midfield.
This creates a useful contrast.
Sociedad can occupy territory around the ball and through midfield without necessarily eliminating Madrid’s ability to attack the space beyond that occupation.
In other words, the blue areas on the Voronoi map demonstrate spatial influence — but they do not automatically mean that Madrid have lost access to dangerous zones.
And the Network Health timeline adds another layer.
Real Madrid record one of their strongest first-half windows between 15’ and 20’ (0.71) and remain positive at 20’–25’ (0.61). Sociedad’s network, meanwhile, reaches an especially weak value in that same 15’–20’ interval (0.89 on the away/downward scale).
Madrid therefore produce strong structural windows even while Sociedad are capable of occupying large areas of the field.
That is a crucial distinction.


The first-half pattern: Sociedad have territory; Madrid preserve threat
The first 46 minutes can therefore be summarised through a simple tactical tension:
Real Sociedad increasingly control space around midfield, while Real Madrid protect the locations from which they can hurt them.
Madrid’s network does not need to be uniformly dominant.
The positioning of Bellingham between lines and Mbappé higher up initially provides central and right-sided depth. Later, Vinícius pushes the left side much higher.
The result is a structure capable of stretching Sociedad vertically even when Sociedad appear territorially strong.
This is also where the xT profile becomes valuable. Real Sociedad’s strong Recovery Zone xT indicates that they are recovering possession in locations with meaningful attacking potential. Their corridor values show routes for progression.
But recovery potential is only one part of territorial control.
The next question is what happens after the game changes state.
And that is where the second half becomes revealing.
45’–70’: Real Madrid begin to own the central geography
The 45’–70’ network looks substantially different from the first-half maps.
Madrid’s spatial control expands.
The purple Voronoi regions now cover much more of the central and defensive-middle zones, while the team’s passing structure becomes visibly connected around the middle of the pitch.
Two positions illustrate the change particularly well.
Federico Valverde occupies the central corridor, sitting almost at the structural heart of Madrid’s network. Ahead of him, Jude Bellingham occupies a higher central/right half-space, providing a natural continuation from midfield into the attacking structure.
This is a different type of control from simply pushing players forward.
Madrid are now controlling the routes through the pitch.
The central area becomes less fragmented. Connections appear between the deeper line, midfield and advanced positions, while Sociedad’s structure is increasingly forced around Madrid’s occupation rather than through it.
And something else changes in the xT radar.
Real Sociedad still maintain the superior Recovery Zone xT, but their Right Corridor xT drops considerably compared with 25’–46’.
That is important because it suggests that Sociedad’s ability to convert recovery positions into threat through that side became less pronounced.
Madrid have not merely gained more territory.
They have changed which territories remain productive for Sociedad.
Madrid’s second-half control is about density, not just possession
The central density visible between 45’ and 70’ deserves attention.
Real Madrid do not spread themselves evenly across the pitch. Instead, the structure concentrates connections through the middle while retaining players in advanced positions.
That gives the team two advantages simultaneously.
First, short distances between central players facilitate circulation and structural support.
Second, the advanced references prevent Sociedad from simply compressing everything into midfield.
This helps explain why Madrid can control substantial areas without creating a completely flat possession network.
The Network Health data supports this phase particularly well.
Madrid post 0.67 between 60’ and 65’, while Sociedad are at 0.47. Madrid then remain structurally ahead through 65’–70’ and 70’–75’.
The game has moved away from the first-half picture in which Sociedad could claim large territorial regions.
Now Madrid increasingly combine territorial control with stronger network organisation.
Want to explore the match yourself?
This analysis is only one layer of what Football Hacking can reveal. In the Web App, you can explore matches interactively using pass networks, Voronoi spatial control, Expected Threat (xT), Network Health, Poisson models, Monte Carlo simulations, match forecasts and more.
Move through different match windows, compare how teams occupy and control the pitch, and turn raw football data into tactical insights.
Explore the Football Hacking Web App and see what the numbers reveal about the game.
71’–100’: the match becomes centrally compressed
The final period produces another transformation.
By 71’–100’, both teams have numerous players concentrated around the central corridor, but Madrid’s structure retains clear external references.
Vinícius Júnior remains high in the left attacking corridor, preserving width and depth away from the congested centre. Kylian Mbappé occupies the high right-central channel, again maintaining an advanced reference outside the densest midfield cluster.
Behind them, the centre becomes extremely crowded.
This is significant because a team protecting a large advantage does not necessarily need to dominate the entire width of the pitch. Controlling the central routes can be more valuable than occupying every peripheral zone.
And Madrid’s Voronoi map reflects precisely that kind of control.
Purple territory covers much of Madrid’s own half and important central sections, while Sociedad retain several zones around the edges and through isolated midfield pockets.
The match has effectively become spatially compressed around the centre.
For Sociedad, that makes progression increasingly dependent on navigating a dense interior or circulating toward less directly threatening external areas.
The 80’–85’ window reveals how strong Madrid’s structure remained
One of the most striking details in the Network Health chart arrives late.
Real Madrid reach 0.73 between 80’ and 85’ — their strongest five-minute Network Health value of the match.
That matters enormously when interpreting a 4–1 game.
Teams with a large advantage can sometimes become structurally loose: distances increase, possession becomes less coordinated and the match turns into disconnected transitions.
The data suggests something different here.
Madrid’s network reaches its best isolated health window deep into the second half.
Even at 85’–90’, the value remains 0.60.
So Madrid’s control was not simply the residue of what happened earlier. Their passing structure continued functioning efficiently late in the game.
That is perhaps the clearest indication that the scoreline and the structural behaviour were moving in the same direction.
Real Sociedad’s strongest metric also exposes the problem
Across the different xT windows, one feature remains remarkably consistent:
Real Sociedad perform very well in Recovery Zone xT.
This is visible in the full-match radar and remains strong across the individual periods.
On its own, that is positive. Recovering the ball in locations associated with higher expected threat can create valuable attacking opportunities.
But the spatial maps reveal why this did not translate into control of the match.
Sociedad could recover possession in useful locations without consistently transforming those recoveries into sustained occupation of Madrid’s most dangerous defensive zones.
The second-half reduction in their right-corridor threat is particularly revealing.
Meanwhile, Madrid’s central occupation becomes stronger.
So the problem was not necessarily where Sociedad recovered the ball.
It was what the surrounding structure allowed them to do next.
That distinction is exactly why combining xT with pass networks and Voronoi control produces a richer interpretation than looking at any metric independently.
Real Madrid changed the geometry of the match
The most interesting conclusion from Real Madrid 4–1 Real Sociedad is therefore not simply that Madrid were better.
It is how the spatial relationship between the teams changed.
During the opening phase, Sociedad could occupy broad areas and compete strongly across the xT dimensions. Madrid were comparatively selective, maintaining advanced references and access to dangerous corridors rather than attempting to dominate every region.
Between 25’ and half-time, Sociedad’s territorial presence became even more visible.
After the break, however, Madrid progressively took possession of the game’s central geography.
Valverde’s occupation of the central corridor and Bellingham’s positioning higher between central and inside areas illustrate that transition particularly clearly. Later, Vinícius and Mbappé maintained the attacking width/depth required to prevent Madrid’s increased central density from becoming passive.
The result was not simply more possession territory.
It was better-connected territory.
What the 4–1 tells us beyond the scoreline
A scoreline tells us what happened.
The underlying structure can help explain how the game arrived there.
Real Sociedad demonstrated meaningful territorial presence, strong recovery-zone xT and competitive progression during portions of the match. Their first half, in particular, cannot be reduced to a team simply being overwhelmed.
But Real Madrid progressively altered the spatial problem.
They preserved attacking depth while Sociedad occupied territory, strengthened the central network after half-time and eventually compressed the match into areas where their own structure became increasingly stable.
The five-minute Network Health evolution captures the consequence beautifully: Madrid produce several strong windows throughout the game and reach their highest value, 0.73, as late as 80’–85’.
That makes the 4–1 particularly interesting from a data-analysis perspective.
Real Madrid did not need to control the same spaces in the same way for 90 minutes. They changed where control mattered — and, as the match progressed, increasingly controlled the areas that connected one phase of play to the next.
That is the difference between simply occupying the pitch and controlling the game.