

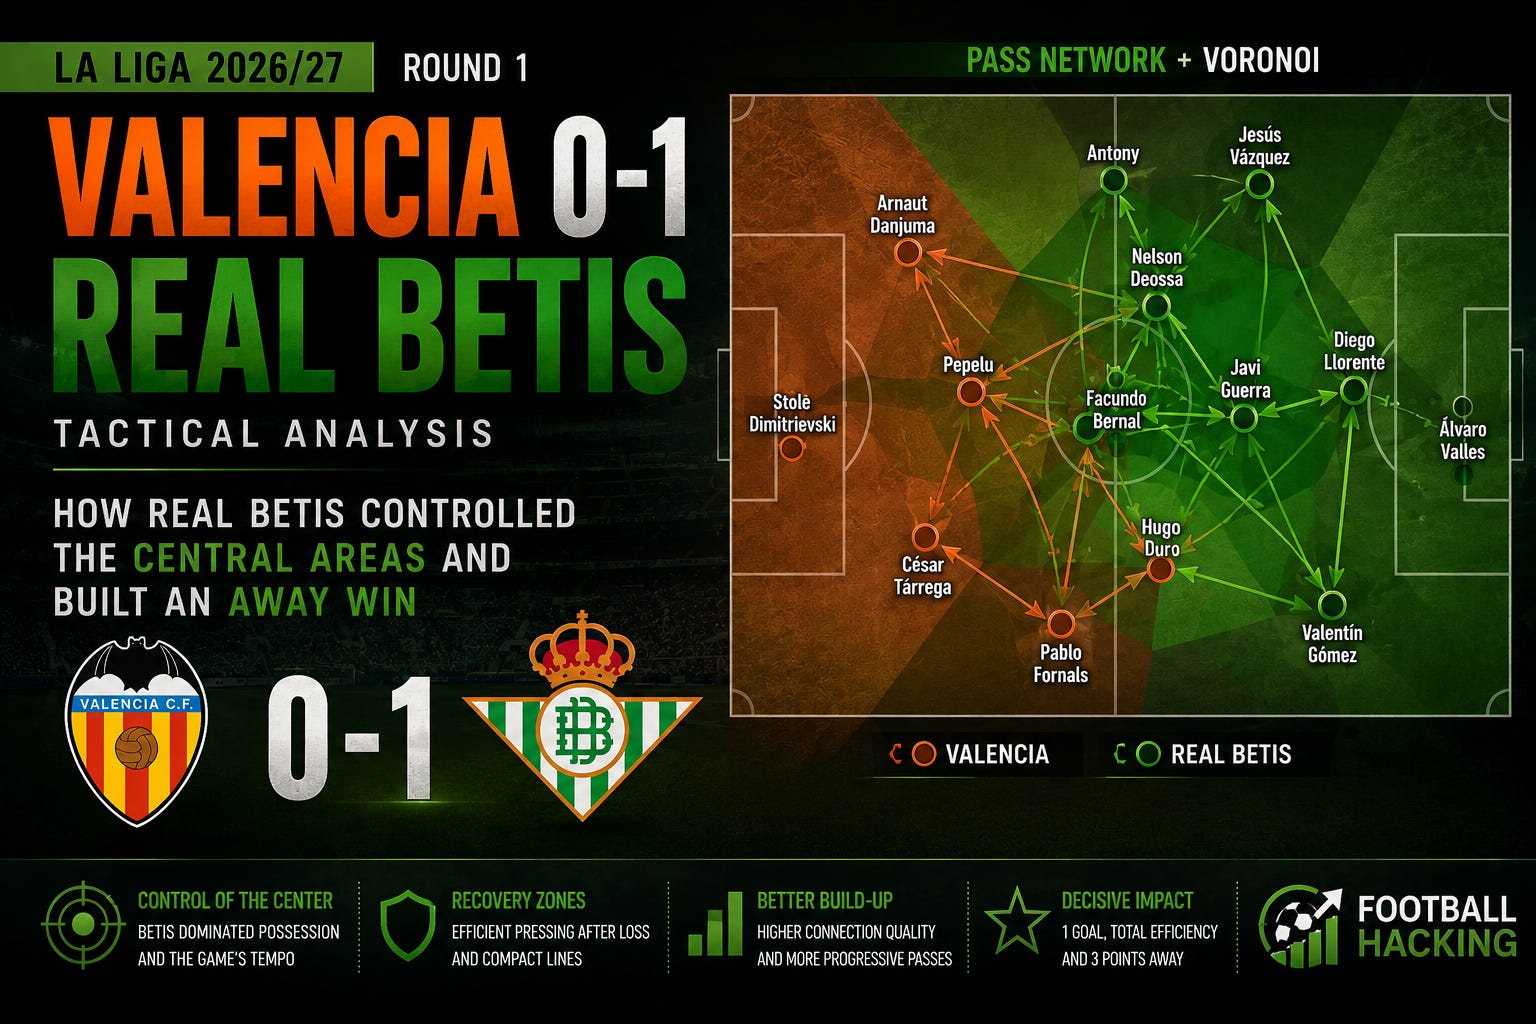
The decisive difference was not constant superiority. It was which team could turn its territorial control into a more useful structure when the match became increasingly compressed.
Disclaimer: No match footage, images or video was used for this analysis. The analysis is based exclusively on data-derived information, including pass-network structure, Voronoi spatial occupation, Network Health, Median xT Destination, Offensive Transition xT, Recovery Zone xT and corridor xT. Set pieces were excluded from the pass-network analysis.
Valencia started with the healthier network
The Valencia 0-1 Real Betis scoreline can make the match look like a straightforward away victory, but the five-minute Network Health windows tell a more nuanced story.
Valencia produced the stronger structural peaks during much of the first half. Their Network Health reached 0.67 between 20 and 25 minutes, while Betis remained at 0.50. Across several early windows, Valencia’s network was at least as healthy as the visitors’ and often healthier.
The spatial structure explains part of this.
Hugo Duro occupied an advanced right-central area, giving Valencia a reference beyond the midfield line, while Arnaut Danjuma operated higher and wider in the right corridor/right half-space. Valencia therefore had a clear vertical orientation on that side rather than simply circulating possession around the centre.
Betis approached the same period differently.
Their occupation was more distributed across the pitch, and their pass network created connections from deeper areas into the central zone instead of concentrating everything around one attacking corridor.
That difference becomes important when we look at xT.
Betis were reaching more valuable recovery areas
The Median xT Destination radar shows the clearest distinction between the teams: Real Betis held a substantial advantage in Recovery Zone xT.
This does not mean that Betis simply recovered more balls. It indicates that the destinations associated with their recovery structure were situated in more threatening areas according to xT.
Their Central Corridor xT was also slightly stronger over the complete match.
That combination matters.
Recovering possession in useful territory and maintaining access to the centre gives a team a shorter route from regaining the ball to threatening the opponent’s defensive structure.
Facundo Bernal, positioned around the central corridor and centre-circle area, became one of the references of that occupation, while Diego Llorente provided connectivity from the right-central defensive zone.
The result was not overwhelming territorial domination. It was a structure capable of connecting different parts of the field without becoming excessively stretched.


The second half changed the geography of the match
This is where the Valencia vs Real Betis tactical analysis becomes particularly interesting.
After halftime, Valencia’s network moved toward a more centrally concentrated configuration.
The Voronoi structure from 46 minutes onward shows significantly more Valencia occupation around the middle third and central corridor. Javi Guerra operated around the central/right-central midfield zone, while Pepelu occupied a somewhat deeper left-central area.
Valencia were effectively bringing more of the game inside.
And their Network Health numbers suggest that this worked structurally.
From 55 minutes onward, Valencia recorded values of 0.59, 0.52, 0.54, 0.44, 0.61, 0.71, 0.63, 0.54 and 0.61 through the final complete five-minute windows.
The 0.71 between 80 and 85 minutes was their highest Network Health value of the entire match.
So this was not a case of Valencia collapsing structurally before conceding.
Quite the opposite.
Betis gave up some space without losing their useful zones
Real Betis’ second-half structure became more selective.
Their network no longer needed to occupy the pitch in exactly the same way as during the opening period. Instead, the data shows important presence around the centre combined with outlets on both sides.
Nelson Deossa occupied the central and left-central midfield area, while Valentín Gómez provided a deeper connection through the right corridor/right defensive half-space.
This created an interesting territorial picture.
Valencia could occupy substantial central areas, but Betis retained enough spatial coverage around them to prevent the game from becoming entirely controlled by Valencia’s network.
The full-match Voronoi map reinforces this. Betis territory appears across large portions of both halves rather than being restricted to a low defensive block.
In other words, Valencia’s possession structure could be healthy without necessarily owning all the strategically valuable territory.
That distinction is crucial when reading passing networks.
The xT profile reveals two different attacking ideas
There is another detail worth highlighting.
Valencia finished with the stronger Right Corridor xT, particularly visible in the second-half radar. Betis, meanwhile, retained their pronounced advantage in Recovery Zone xT and a smaller advantage through the Central Corridor xT.
That suggests two different ways of progressing toward dangerous territory.
Valencia increasingly found value through the right side. Betis’ structure was more closely associated with central occupation and valuable territory following recoveries.
Neither approach is automatically superior.
But in a match decided by a single goal, the ability to recover and reconnect play from valuable central areas can have enormous tactical importance.
The 87th-minute goal came against Valencia’s strongest structural period
Perhaps the most interesting detail in the entire Valencia 0-1 Real Betis analysis is the timing of the goal.
Betis scored around the 87th minute.
Immediately before that, Valencia had produced its strongest Network Health window of the match: 0.71 between 80 and 85 minutes, compared with 0.40 for Betis.
That is a useful warning against interpreting network metrics as a scoreboard.
A healthy passing network measures structural properties of possession and connectivity. It does not guarantee that the team controls every transition, every recovery or every dangerous spatial situation.
Valencia were structurally healthy.
Yet Betis still had the tools to hurt them.
And the xT radar provides a clue as to why: the visitors’ strongest comparative advantage throughout the match remained associated with Recovery Zone xT.
Explore the Full Analysis in the Football Hacking Web App
Want to explore Valencia vs Real Betis beyond this article? The Football Hacking Web App lets you interact with the same data behind this analysis — adjust match periods, explore pass networks, Voronoi spatial control, xT by corridor, recovery zones, offensive transitions and Network Health.
You can also go deeper with Poisson models, match probabilities, Monte Carlo simulations and other data-driven tools designed to turn football data into tactical insight.
See the match. Change the time window. Test the patterns. Find your own answers.
Valencia controlled more of the ball structure; Betis controlled different spaces
The most useful conclusion from this LaLiga 2026/27 tactical analysis is therefore not that one team completely dominated the other.
The match was much more subtle.
Valencia produced several periods of superior Network Health and became particularly strong structurally late in the second half. Their spatial organisation increasingly concentrated around midfield, while their right corridor generated meaningful xT.
Real Betis showed another kind of control.
Their network distributed occupation across the field, maintained central connections and, most importantly, reached significantly stronger xT values in recovery zones. As the second half progressed, Betis could concede portions of territorial control without becoming disconnected from the areas that mattered to their own progression.
The 0-1 result ultimately emerged from that tension.
Valencia became structurally stronger as the match progressed. Betis did not need to erase that advantage. They needed to remain connected enough to exploit the right moment.
That may be the central lesson of Valencia 0-1 Real Betis: controlling the field and controlling possession structure are related, but they are not the same thing. Betis found a way to preserve access to valuable spaces even when Valencia’s network looked healthier — and in a match of very small margins, that difference was enough.