

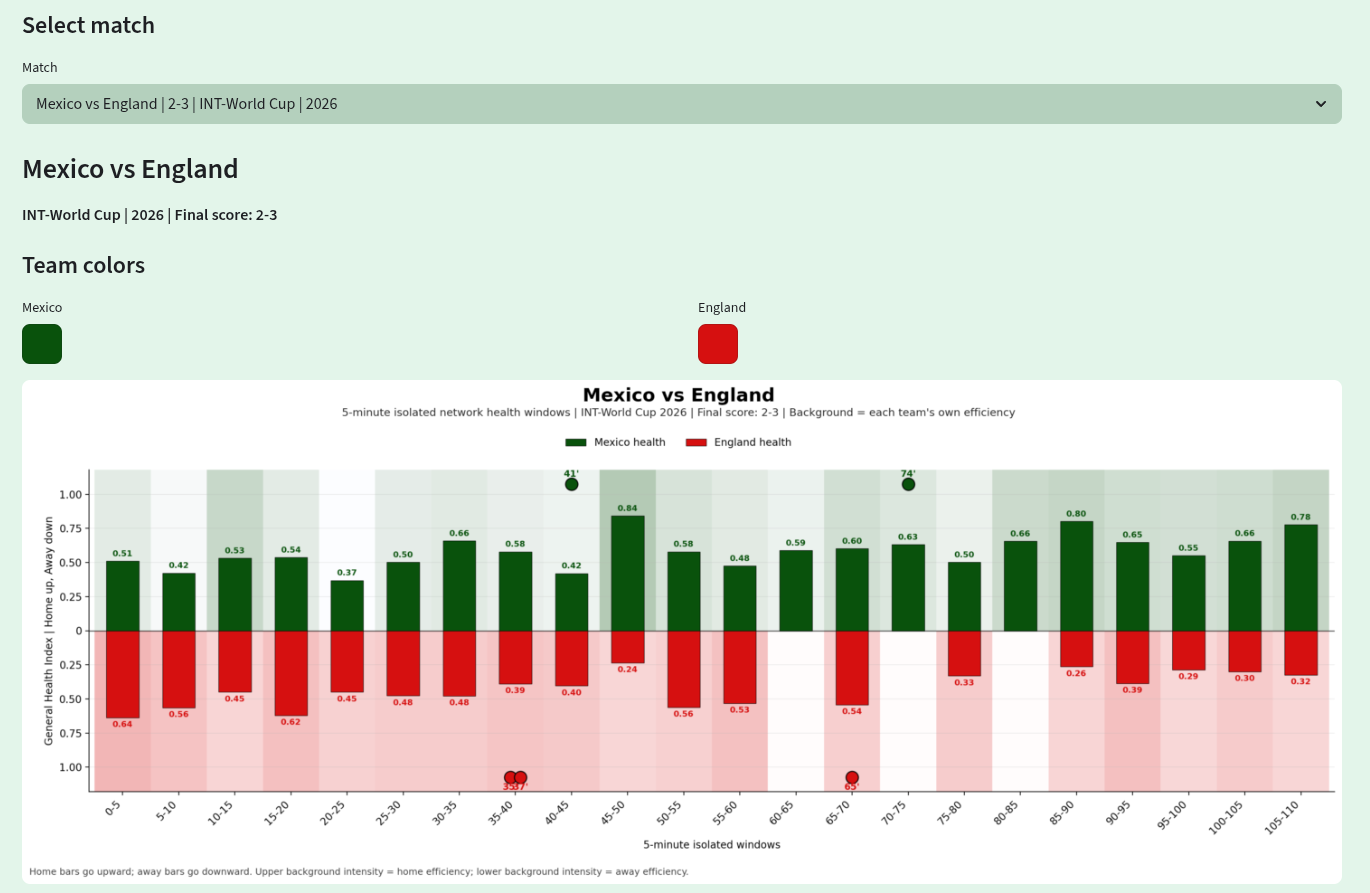
Every FIFA World Cup produces millions of conversations around possession, shots, expected goals (xG), pass accuracy, and final scores. While these statistics provide valuable context, they rarely explain why one team truly controlled a match or how tactical superiority developed over ninety minutes.
Modern football is far more complex than goals and possession percentages. The best teams dominate through structure, intelligent positioning, coordinated pressing, and efficient transitions. Those elements often remain invisible in traditional match reports.
That is exactly why every World Cup match at Football Hacking is analyzed using advanced football analytics, combining network science, Expected Threat (xT), Monte Carlo simulations, league-specific Poisson models, customized Dixon-Coles models, and proprietary metrics developed to understand how matches actually unfold.
The objective is simple: move beyond describing football and start explaining it.
Football Is a Network, Not Just a Collection of Passes
Every completed pass creates a connection between two players.
Across an entire match, thousands of these connections form a dynamic network that constantly changes according to pressing intensity, tactical adjustments, substitutions, and game state.
Instead of asking only who completed the most passes, network analysis asks far more meaningful questions:
Which players connect the entire team?
Which players become isolated?
Is possession flowing naturally or becoming predictable?
How resilient is the team’s structure under pressure?
Is the attack diversified or dependent on only one passing route?
These questions reveal tactical information that conventional statistics simply cannot capture.
Two teams may finish with identical possession numbers while producing completely different football.
The difference lies in their structure.
Why Team Structure Matters More Than Possession
Possession has never guaranteed control.
A team can keep the ball for long periods without creating genuine danger, while another side can dominate the game’s structure with significantly less possession.
Network metrics allow us to measure whether a team’s passing system is:
balanced,
centralized,
flexible,
resilient,
predictable,
or highly efficient.
Throughout this World Cup, we have repeatedly observed matches where structural superiority explained the outcome much better than raw possession percentages.
Football is ultimately about controlling space, not simply controlling the ball.
Expected Threat (xT): Measuring How Teams Build Danger
Expected Goals (xG) begins its evaluation once a shot is taken.
Expected Threat (xT) starts much earlier.
Every location on the pitch carries a different probability of eventually leading to a goal. Moving the ball into more dangerous areas increases that probability.
Instead of measuring only finishing quality, xT measures territorial progression.
It allows analysts to quantify how effectively a team transforms possession into attacking potential long before a shot is attempted.
This adds an entirely new dimension to football analysis.
Defensive Ball Recovery xT: Where Winning the Ball Changes Everything
Recovering possession is not equally valuable everywhere on the pitch.
Winning the ball inside your own defensive third is fundamentally different from recovering it just outside the opponent’s penalty area.
Our Defensive Ball Recovery xT metric evaluates where possession is regained, assigning an Expected Threat value to every successful recovery.
High recovery xT frequently reflects:
aggressive pressing,
compact defensive organization,
successful counter-pressing,
immediate attacking opportunities.
In modern football, defending is often the first phase of attacking.
By measuring the quality of recovery locations, we can objectively evaluate that relationship.
Ready to explore football beyond the scoreboard?
Visit about.footballhacking.com
to discover how Football Hacking combines Network Analysis, Expected Threat (xT), Monte Carlo simulations, league-specific Poisson models, customized Dixon-Coles models, and proprietary performance metrics to deliver deeper insights into every match. Whether you’re a football analyst, bettor, coach, or simply passionate about the tactical side of the game, Football Hacking offers a smarter way to understand modern football through data-driven analysis.
Offensive Transition xT: Measuring the Fifth Pass After Ball Recovery
One of the newest metrics introduced into our World Cup reports is Offensive Transition xT.
Transitions are among the most decisive moments in elite football.
Winning possession creates opportunity.
The real question is how effectively that opportunity is developed.
Our methodology follows every successful defensive recovery and evaluates the location reached exactly on the fifth completed pass after possession is regained.
This point deserves clarification.
This metric is not the average Expected Threat generated across five passes.
It is not the cumulative xT created during the transition.
Instead, we record the xT value of the location where the fifth completed pass finishes.
Why the fifth pass?
Because it generally represents the moment when the transition has evolved beyond immediate ball recovery into an organized attacking sequence.
The first pass usually secures possession.
The following passes stabilize and accelerate progression.
By the fifth completed pass, the attacking structure has normally taken shape, making it an excellent reference point for evaluating transition quality.
Teams capable of consistently reaching dangerous areas by the fifth pass demonstrate superior transition efficiency.
Others recycle possession without significantly increasing attacking threat.
Traditional football statistics rarely distinguish between these situations.
Offensive Transition xT does.
Looking Beyond the Final Score
Goals remain the most important events in football.
They are also among the rarest.
Structural dominance happens throughout every minute of every match.
A team can lose despite demonstrating superior organization, better territorial control, stronger transitions, and more effective pressing.
By combining:
Football Network Analysis,
Expected Threat (xT),
Defensive Ball Recovery xT,
Offensive Transition xT,
Monte Carlo Simulation,
League-Specific Poisson Models,
Customized Dixon-Coles Models,
we obtain a much more complete explanation of football performance.
Rather than asking only who scored, we investigate:
Who controlled space?
Who built the stronger network?
Who recovered possession in dangerous areas?
Who transformed recoveries into attacking threat?
Which tactical structure remained more stable throughout the match?
These questions explain football at a much deeper level than traditional statistics ever can.
The Future of Football Analytics Starts Here
Modern football demands modern analysis.
As tactics continue evolving, relying solely on possession, shots and xG is no longer enough to understand elite competition.
Network science reveals relationships.
Expected Threat measures territorial value.
Transition metrics explain how attacks develop.
Probabilistic models estimate future performance.
Together, they provide a comprehensive framework for analyzing the world’s biggest football tournament.
Every World Cup report published by Football Hacking is built around this philosophy: uncover the hidden tactical story behind every match using advanced football analytics that go far beyond the scoreboard.
If you want to experience a deeper way of understanding football through network analysis, Expected Threat (xT), Monte Carlo simulations, customized Poisson and Dixon-Coles models, and proprietary performance metrics, visit about.footballhacking.com and discover the Football Hacking project.
Because football is far more than goals.
It’s a network of decisions waiting to be decoded.
Really great piece which club or league do you follow mate