
You Can Now Download All the Data from the Football Hacking App (And Build Your Own Visuals)

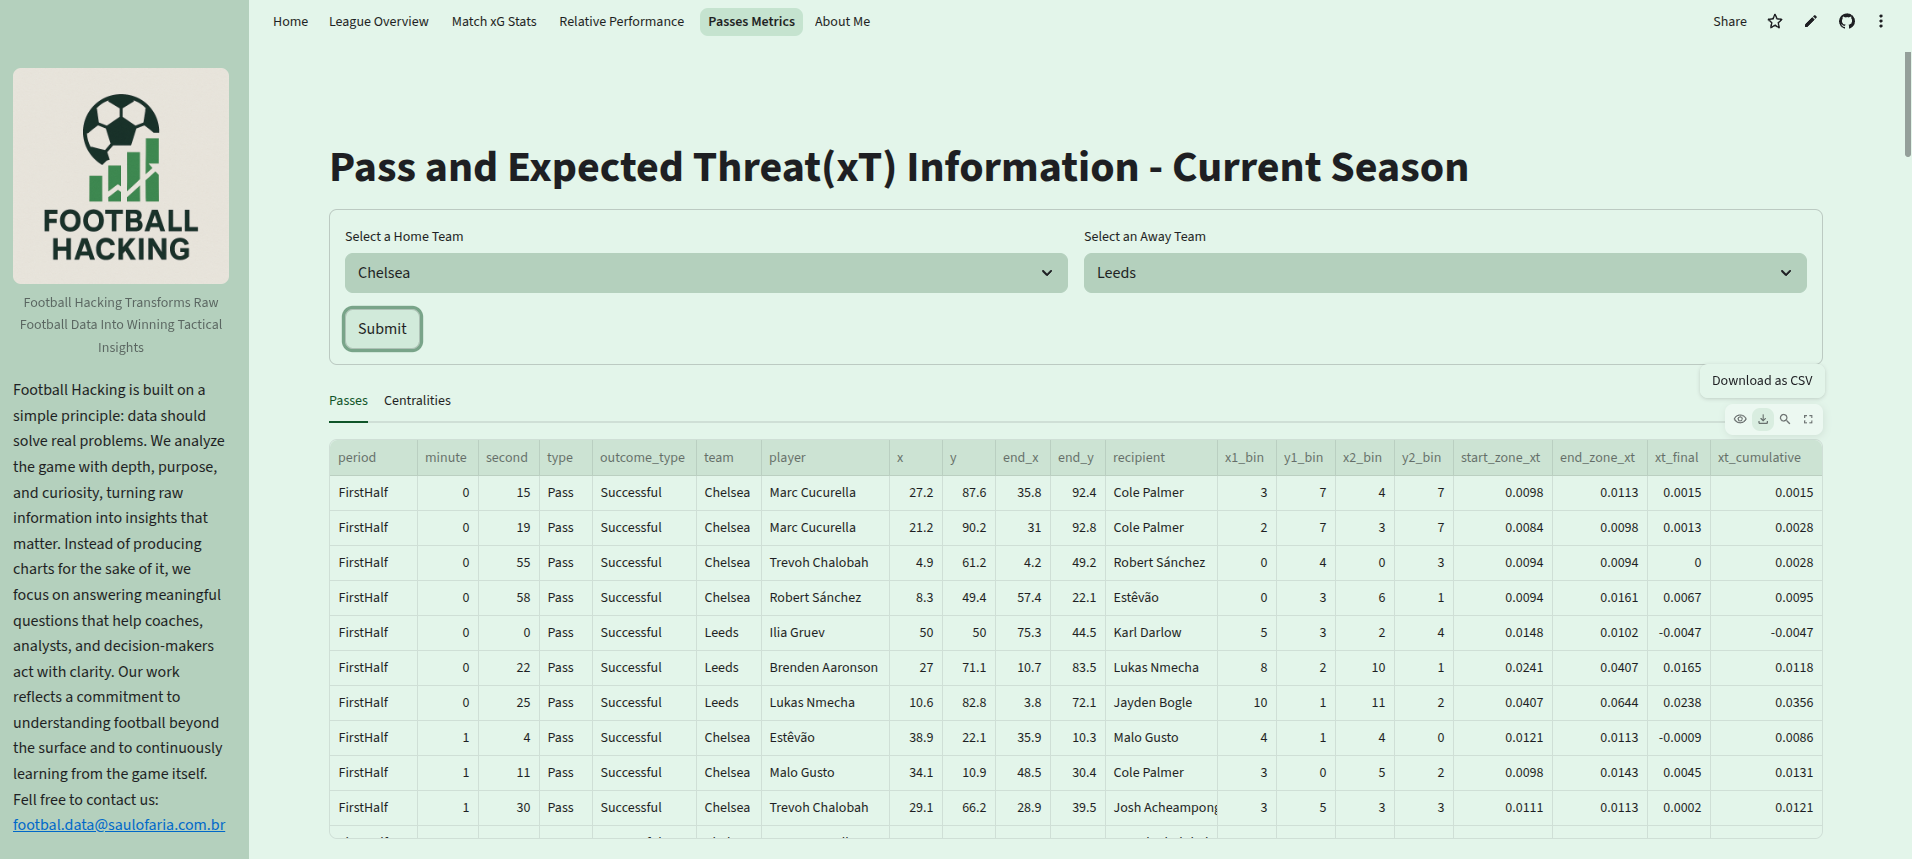
If you’ve ever wanted to go beyond looking at charts and actually get your hands on the data, this update is for you. 👉 Visit the Football Hacking web app today, explore the matches, and you’ll see something new: all the data used to generate the charts is now available for download. And if you’re not yet a subscriber, this is the perfect moment to join the Football Hacking newsletter and follow everything that’s coming next.
Yes, you read that right. From now on, when you explore a match, a team, or a specific visualization in the app, you can also download the underlying dataset and use it however you want. No black boxes. No “trust me, this is what the numbers say.” You get the numbers. You get the control.
This is a big step toward what I believe is one of the most important principles in football analytics: independence.
Why This Changes the Game
Most platforms show you beautiful charts, dashboards, and tables—but that’s where it ends. You’re stuck with someone else’s choices:
Someone else’s color scales
Someone else’s chart types
Someone else’s filters and thresholds
Someone else’s interpretation of what matters
Now, with the Football Hacking app, you’re not limited to that anymore. You can download the exact same data used to build the visualizations and take it wherever you want: Python, R, Excel, your own dashboards, your own notebooks, your own experiments.
Want to tweak the pitch dimensions?
Change the binning of zones?
Highlight different players?
Compare two matches in a way the app doesn’t show yet?
Go for it. The data is yours.
This is especially powerful if you’re already working with Python and libraries like mplsoccer, which is quickly becoming the standard tool for football visualizations in the data community.

Build Your Own Visuals with mplsoccer
If you’re not familiar with it yet, mplsoccer is a Python library built on top of Matplotlib that makes it much easier to create football-specific charts: pitches, heatmaps, pass networks, shot maps, and much more.
With the data downloaded from the Football Hacking app, you can:
Recreate the same charts you see in the app
Customize them to match your style or your club’s branding
Combine multiple matches into a single analysis
Build entirely new visualizations that don’t exist yet in the app
For example, instead of just looking at a pass map, you might want to:
Build a pass network with custom thresholds
Change node sizes based on a metric you prefer (xT, involvement, touches, centrality, etc.)
Compare first half vs second half
Overlay tactical zones or specific patterns
And the best part? You’re no longer dependent on any single tool or interface. You’re building your own analytical workflow.
Independence Is Not a Buzzword
In football analytics, independence is everything.
When you control the data, you control:
The questions you can ask
The hypotheses you can test
The stories you can tell
The mistakes you can discover and fix
Relying only on ready-made charts is comfortable, but it also puts a ceiling on your growth. You start thinking in terms of “what the tool allows me to see” instead of “what I want to investigate.”
By making the data downloadable, the Football Hacking app becomes not just a place to consume insights, but a place to start your own analysis.
And that’s exactly the point.
👉 If you haven’t yet, go to the Football Hacking web app now, explore a match, download the data, and try building your first custom chart. Also, subscribe to the Football Hacking newsletter to stay close to everything that’s coming next.
A New Premium Series Is Coming (Including Pass Networks)
This update is also a preview of what’s ahead.
Very soon, I’ll be launching a new series for premium subscribers where I’ll walk you step by step through building different types of football visualizations using Python and mplsoccer.
We’ll cover things like:
Shot maps and chance quality visualizations
Heatmaps and positional maps
Progressive actions and zone-based charts
Pass networks (yes, properly built and interpreted)
And several other practical, match-analysis-driven graphics
The idea is simple: you’ll use the same data you can download from the app, and I’ll show you how to turn it into clear, insightful, and professional-looking charts.
If you’ve ever looked at a visualization and thought, “I wish I knew how to build this myself,” this series is for you.
From Viewer to Builder
This is the shift I care most about.
Not just giving you charts.
Not just giving you metrics.
But giving you the tools and the data to become a builder of your own analysis.
Whether you’re a student, an analyst, a coach, a content creator, or just someone obsessed with understanding the game more deeply, having access to the raw data changes how you think. You stop being a spectator of analytics and start becoming an active participant in the process.
And that’s exactly what Football Hacking is about.
Start Today
Here’s what I recommend you do right now:
👉 Visit the Football Hacking web app
Explore a match or a team
Download the data used in the charts
Open Python and try a simple mplsoccer plot
See how much freedom you suddenly have
And if you want to follow the upcoming tutorials, deep dives, and the full visualization series, become a subscriber to the Football Hacking newsletter—especially the premium tier, where all the hands-on content will live.
This is just the beginning. The data is now in your hands. Let’s build something great with it. ⚽📊