

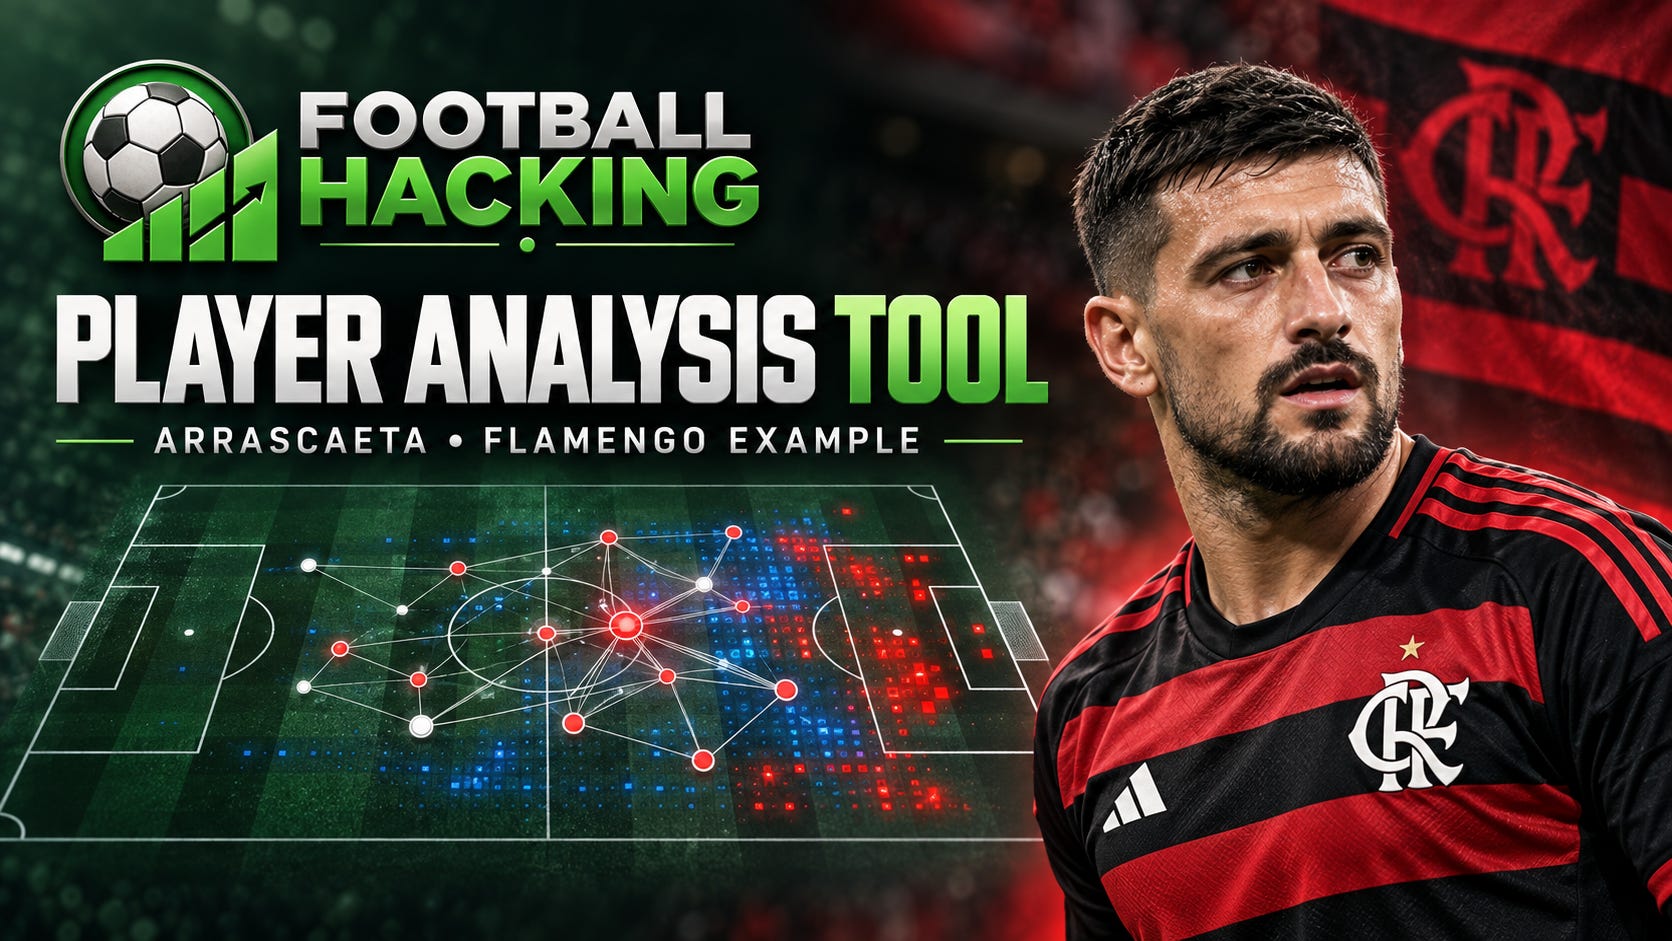
When people evaluate a football player, they often begin with goals, assists, shots, and minutes played. Those numbers are useful, but they leave important questions unanswered. Where does a player fit into the team’s passing structure? Does he regularly connect teammates, influence the circulation of the ball, or become a preferred target? Where on the pitch does he receive and play successful passes, and how does the territorial threat associated with those actions change?
The new Player Analysis feature in the Football Hacking Web App is designed to help explore those questions. It combines a match-by-match view of a player’s role in the passing network with season-long pitch maps of successful open-play passes. To show how the feature works, this article uses the available example for Giorgian de Arrascaeta of Flamengo.
The goal is not to reduce a player to a single score or label. It is to give analysts a clearer way to inspect recurring patterns, notice how a role varies from match to match, and decide what deserves a closer look in the underlying games.
Want to explore the player charts yourself? Visit the Football Hacking Web App and use code HACKING25 for 25% off your first three months. You can cancel whenever you want.
What the Arrascaeta player analysis shows
The example covers 21 appearances, with all 21 matches included in the role chart. Across the data shown, Arrascaeta has 740 received passes and 604 made passes. These totals provide context for the maps, while the charts show how those actions relate to his position within Flamengo’s passing structure and to their locations on the pitch.
The feature has three main visual components:
A player roles in the pass network chart, with one point for each eligible match.
A received passes pitch map, showing where the successful passes to Arrascaeta originated.
A made passes pitch map, showing where Arrascaeta played successful passes from.
Together, these views move the analysis beyond a season total. They help distinguish a player’s recurring involvement from the different ways he may contribute in individual matches.
Reading the pass-network role chart
The role chart places Receiving Influence · PageRank on the horizontal axis and Flow Connector · Load Centrality on the vertical axis. Each point represents one match. The chart is divided into four regions, each describing a different relationship between the player and the passing network.
The vertical and horizontal dashed lines divide the chart according to the match-level reference values. A point’s position therefore helps answer a relative question: in that match, was Arrascaeta more involved as a connector, more influential as a receiving option, both, or neither compared with the players in the network?
In this example, many points appear in the lower-right “Preferred Target” region. This pattern suggests that Arrascaeta often ranks relatively high in receiving influence while sitting below the chart’s reference level for flow connector centrality. Put simply, teammates frequently connect with him, but his role in a particular match is not always defined by being one of the network’s main bridges for passing flow.
Several points appear in the upper-right “Structural Hub” region. In those matches, the chart indicates a stronger combination of receiving influence and flow centrality. Arrascaeta is not only an influential option to find; he also occupies a more central position in how passes move through the network. That can be a useful distinction when comparing his involvement across performances: a player may remain an important receiver while becoming more structurally connected in some games than in others.
There are also points in the upper-left “Flow Connector” region. These suggest matches in which Arrascaeta’s connector score is relatively high even though his receiving influence is below the reference line. This could correspond to a different kind of network contribution from his preferred-target matches. The chart identifies where that difference appears; match footage and event context are still needed to explain the tactical reason behind it.
Finally, some points sit in the lower-left “Peripheral Role” region. In those matches, both measures are comparatively low within the plotted network. This does not mean that Arrascaeta played poorly or had no influence on the result. It means that these two network measures place him in a less central role relative to the other eligible players in that match. A player can contribute through actions that the chart does not capture, and a less central network position may also reflect the team’s tactical plan, game state, or the way possession was distributed.
The key is the variation across the 21 matches. Rather than assigning Arrascaeta one fixed role for the whole season, the chart shows that his relationship with Flamengo’s passing network changes. The recurring concentration in the Preferred Target area, together with points in the Structural Hub and Flow Connector areas, provides a starting point for investigating when and how his network role shifts.


What does PageRank mean in a passing network?
In a passing network, players are connected through passes. PageRank helps describe a player’s receiving influence by considering not only how often he is found, but also the network context of those connections. It offers a way to identify players who occupy influential receiving positions within the structure.
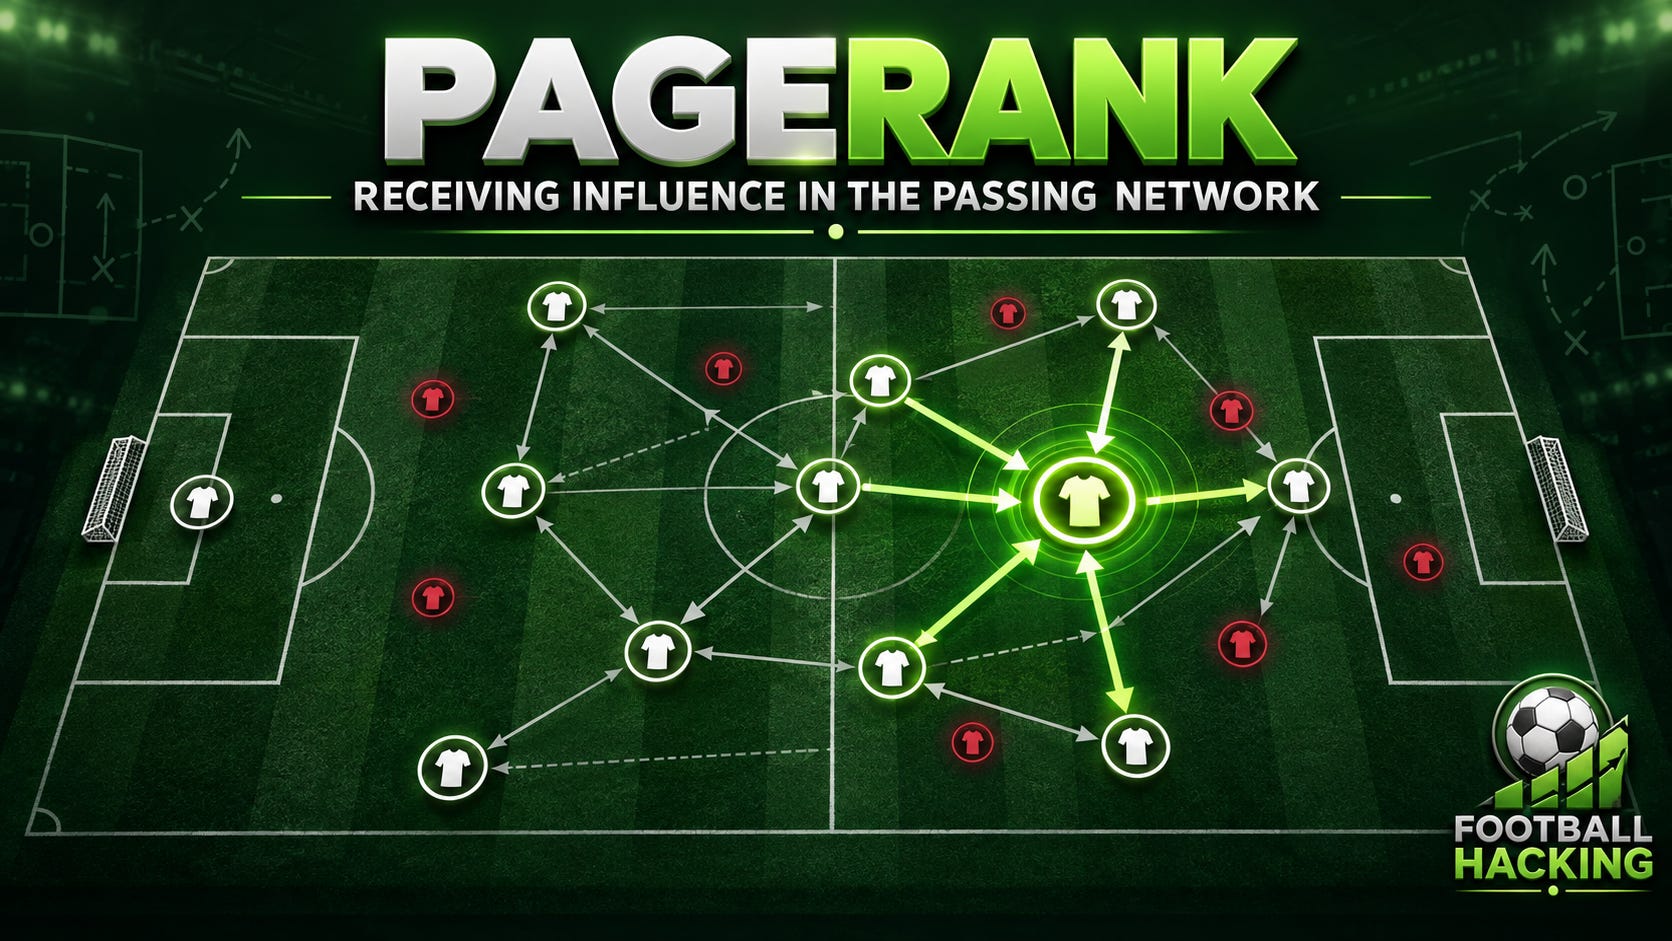
That distinction matters because raw pass counts alone can be misleading. Two players may receive a similar number of passes, but their connections may sit in different parts of the network or involve different teammates. PageRank adds a structural perspective to the count.
For this feature, the role measures use the full team network for each match and are normalized across eligible players from both teams. That means the chart should be read as a match-by-match comparison within the network, not as an absolute rating that can be compared without qualification across every context.
What does Load Centrality reveal?
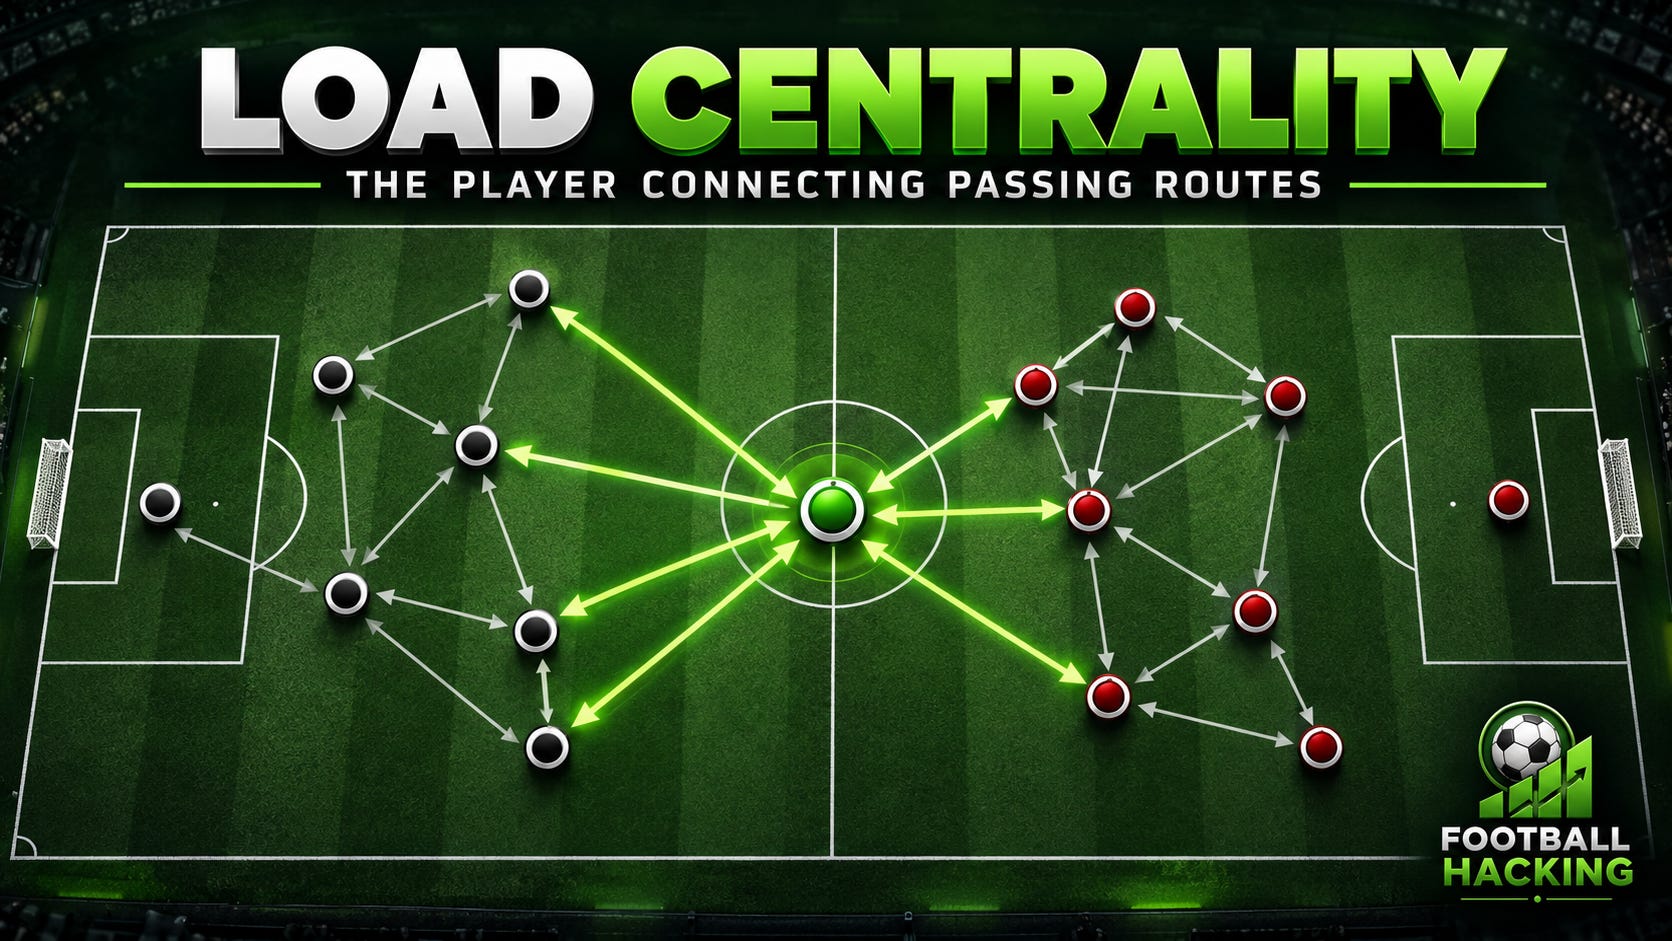
The chart’s Load Centrality measure helps describe a player’s position as a connector in the flow of the network. A player with a higher value may lie on more of the routes that link other players, which can make him an important intermediary in the team’s passing structure.
For Arrascaeta, the chart shows that high receiving influence does not always coincide with high connector centrality. Many points sit to the right of the vertical reference line and below the horizontal one, while a smaller group occupies the upper-right area. This separation is analytically useful: being a frequent or influential target and acting as a central bridge are related possibilities, but they are not the same role.
The distinction can guide more focused review. An analyst might compare matches from the Preferred Target region with those in the Structural Hub region, then inspect whether the difference relates to teammates’ positions, the opponent’s defensive shape, possession volume, or the phase of the game. The chart does not answer every tactical question by itself; it helps identify which comparisons are worth making.
How recency adds context
The points are shaded by recency. Lighter points represent older matches, while darker points represent more recent ones. This allows the chart to show not only where the player’s role has varied, but also when those variations occurred.
The recency scale is helpful when reviewing change over time. For example, an analyst can see whether recent points are concentrated in a different region from earlier ones, or whether a role pattern appears throughout the selected sample. It should still be treated as context rather than proof of a trend: a few recent matches may differ for reasons that require match-level review.
One practical approach is to select a recent cluster or outlying point and compare it with a similar match from earlier in the sample. That turns the chart into a navigation tool for analysis, helping the user move from a season overview to specific games that may explain the pattern.
The received-passes map: where Arrascaeta is found
The first pitch map is titled “Received passes · Origin at teammate.” It plots the origin of successful open-play passes played by teammates to Arrascaeta. In other words, each point represents where a teammate was positioned when making a pass that was received by the selected player.
In the example, the points span a broad area of the pitch, with visible concentrations across central and advanced zones as well as passes originating from deeper positions. This suggests that the map captures a range of situations in which Arrascaeta becomes an option, rather than a single fixed location from which teammates find him.
The color scale represents ΔxT, or the change in expected territorial threat associated with the pass. Blue marks a gain, red marks a reduction, and the shared scale is centered around zero. Most points appear close to neutral grey, with a smaller number of more clearly blue or red actions. That is a useful reminder that not every successful pass produces a large change in territorial threat, and that a pass can still matter for circulation, retention, or the next action.
The made-passes map: where Arrascaeta plays from
The second map, “Made passes · Origin at selected player,” plots the pitch locations from which Arrascaeta played successful open-play passes. As with the received-pass map, each point is a pass origin, and color indicates the associated change in xT.
The distribution again covers a wide range of locations, with many points in central and advanced areas. This lets the analyst compare where Arrascaeta tends to receive the ball with where he tends to play from. The two maps answer different questions: the first looks at the locations of his teammates when they pass to him; the second looks at his own locations when he makes a pass.
The same red-to-blue scale is used for both maps, making the visual comparison easier. In the screenshot, many actions on both maps sit close to the neutral center of the scale, while a smaller number show clearer gains or reductions in territorial threat. This is not a rating of whether a pass was “good” or “bad.” A negative ΔxT means lower modeled territorial threat after the action; it does not, by itself, establish that the decision was poor. A backward or lateral pass may help Flamengo retain possession or create a better route for a later action.
Want to explore the player charts yourself? Visit the Football Hacking Web App and use code HACKING25 for 25% off your first three months. You can cancel whenever you want.
Why the two pitch maps use the same scale
The maps share a symmetric ΔxT scale, which places gains and reductions on opposite sides of zero. Using the same scale makes it easier to compare colors between the received-pass and made-pass maps without interpreting each map on its own color range.
The maps also follow the same coordinate convention as the match-analysis page, with the attack direction shown on the pitch. That consistency matters because it helps users build familiarity across different areas of the app. A user can move between match analysis and player analysis without having to relearn how the pitch is oriented or how the color scale is interpreted.
The data shown is limited to successful open-play passes with inferred receivers. Set pieces are excluded from the maps. Receiver identification is inferred from the event data, so the maps should be read with that methodological detail in mind. This filtering keeps the visual focus on open-play passing patterns, while also making clear what kinds of actions are represented.
European Football Passing Profiles: What KMeans Reveals About 150 Teams

Paid subscribers can download the spreadsheets used as the basis for this article.
How to use the feature in a real analysis
A useful analysis usually begins with a question, not a screenshot. For example: does Arrascaeta occupy a similar receiving role in every match, or does his network position change? Which games place him in the Structural Hub region? Do matches where he appears as a Preferred Target show a different distribution of received-pass origins? When his own pass origins shift, does the network chart also show a change in connector centrality?
The feature supports a workflow built around those questions. Start with the role chart to identify recurring regions and matches that stand out. Then use the pitch maps to examine the locations behind the player’s involvement. Finally, return to the match itself to evaluate the tactical context. The charts help narrow the review; they do not replace video, scouting judgment, or a wider assessment of performance.
For a recruitment or squad-planning workflow, this kind of player analysis can also help frame comparisons. Rather than asking only whether two players have similar goal or assist totals, an analyst can investigate whether their receiving influence, network position, and pass-origin distributions look alike. Any comparison still needs consistent samples, competition context, playing time, and tactical role. The feature makes those questions easier to explore; it does not declare that players are interchangeable.
Player analysis built for exploration
The Arrascaeta example shows why a player’s contribution is difficult to describe with a single label. Across the 21-match role chart, his points appear in multiple regions, with a recurring presence as a Preferred Target and additional matches in which the chart places him as a Structural Hub or Flow Connector. The pitch maps add another layer by showing where teammates’ successful passes to him originate and where he plays successful passes from.
That combination makes the new Football Hacking Player Analysis feature useful for analysts, coaches, scouts, and football fans who want to explore passing structure in more detail. It connects a match-by-match network view with season-level spatial maps, while keeping the underlying measures visible enough for the user to investigate the evidence rather than rely on a single summary label.
Watch the Player Analysis feature in action
Explore Giorgian de Arrascaeta’s passing-network roles and season-long received-pass and made-pass maps in the Football Hacking Web App.
I look forward to seeing you in the next analysis—and discovering what surprises and insights the data will reveal.

Want to explore the player charts yourself? Visit the Football Hacking Web App and use code HACKING25 for 25% off your first three months. You can cancel whenever you want.